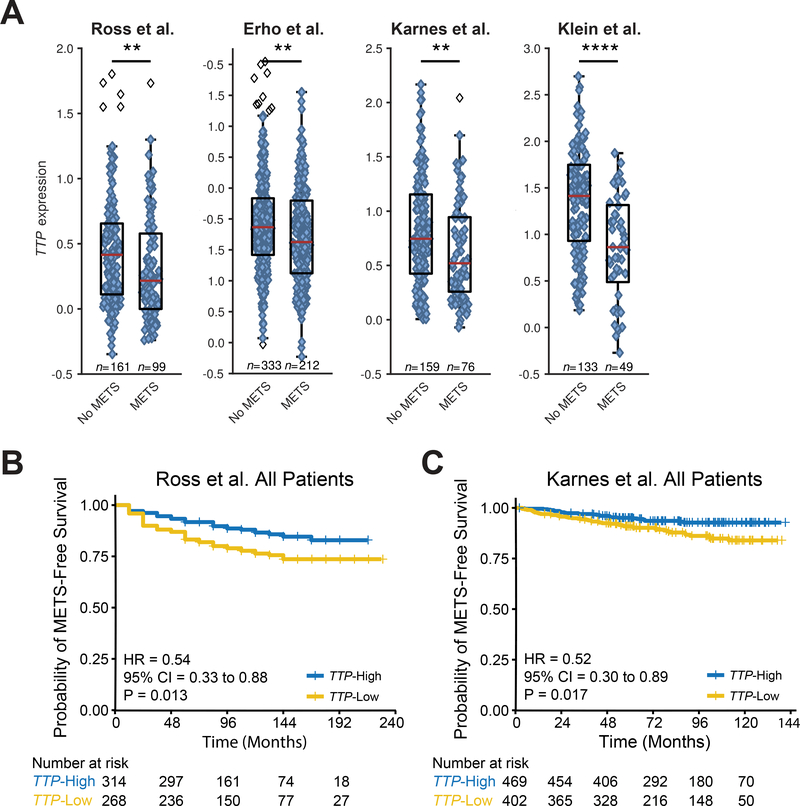
Figure 4.
TTP RNA expression predicts risk for progression to metastatic disease. A, Box-and-whisker plots of multiple patient cohorts (Ross et al., Erho et al., Karnes et al., and Klein et al.) showing TTP RNA levels at prostatectomy in prostate tumors that remained indolent (No METS) versus tumors that progressed to metastasis (METS) (**p < .01, ****p < .0001, two-sided Mann-Whitney U test). B and C, Kaplan-Meier curves showing the time to metastasis in primary prostate cancer patients separated into TTP-High and TTP-Low subtypes based on median TTP RNA expression levels in the Ross et al. (B) and Karnes et al. (C) cohorts (p-values, Mantel-Cox log-rank test).

