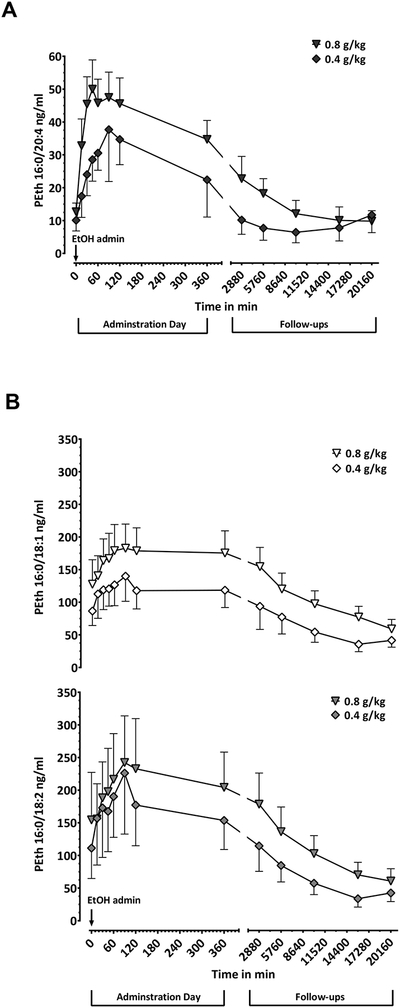
Fig. 1:

A)PEth 16:0/20:4 time course profile in blood samples from participants after given two initial doses of 0.4 g/kg (diamonds) and 0.8 g/kg (triangles) of alcohol. Blood samples were collected at 0, 15, 30, 45, 60, 90, 120 and 360 minutes after alcohol intake and at 2880, 5760, 10080, 15480 and 20160 minutes during follow-ups (2nd, 4th, 7th, 11th and 14th day respectively). B) PEth 16:0/18:1 (top curves) and PEth 16:0/18:2 (bottom curves) levels from the same blood samples, same time points and same doses as A) (0.4 g/kg, rhomboids and 0.8 g/kg triangles). PEth concentrations were not adjusted for background. Error bars are shown as SEM for easy visualization of the curves.
