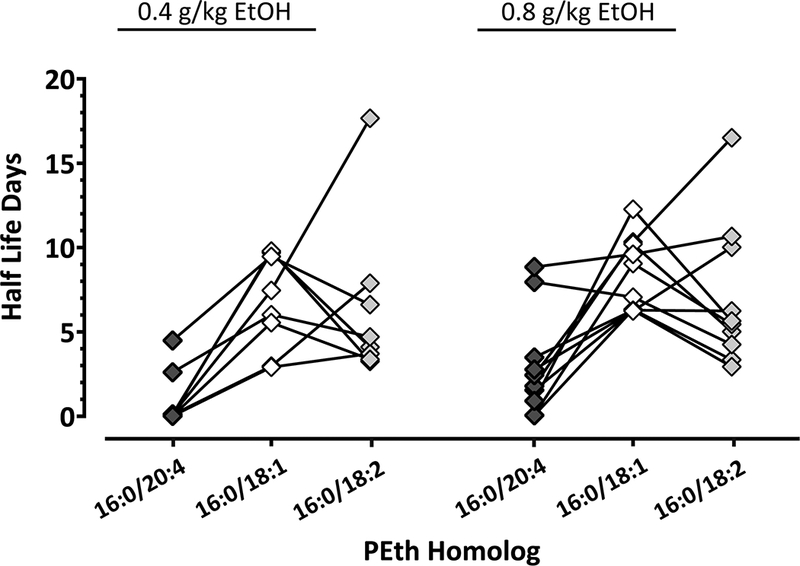
Fig 3. PEth 16:0/20:4 Half-Life.

Individual half-lives were measured from the highest peak at administration time (Cmax) to the last follow-up time point and values shown in an individual scatter plot graph. PEth 16:0/20:4 (black diamonds) half-life is compared to the half-lives of PEth 16:0/18:1 (white diamonds) and PEth 16:0/18:2 (grey diamonds). The homologs corresponding to the same participant are connected for a line.
