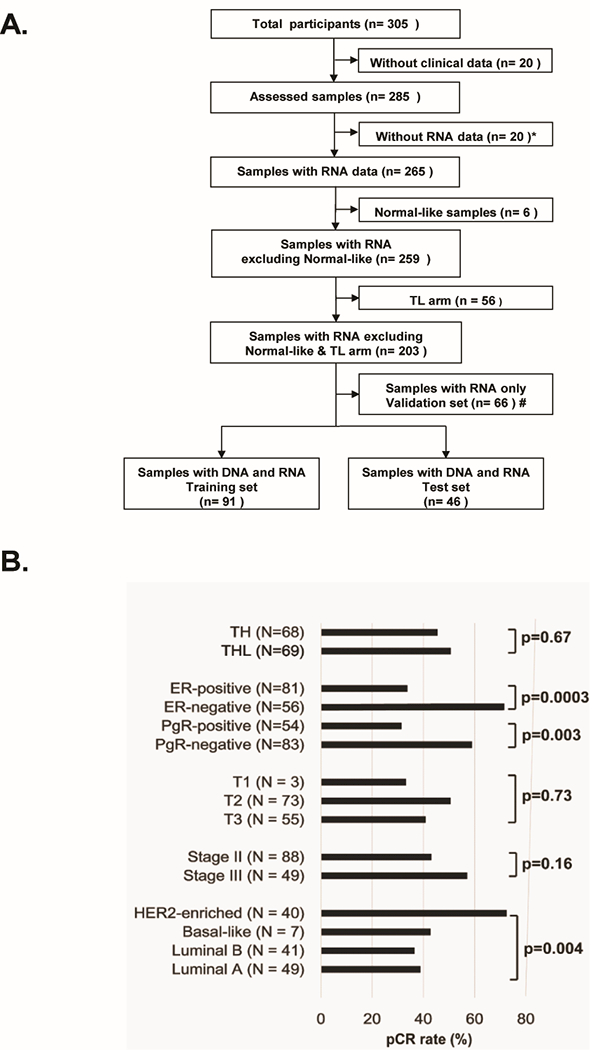
Figure1. CONSORT diagram of patient selection and characteristics.

(A) Sample flow chart to show how samples were selected. Starting with 305 patients, specimens were removed for multiple reasons including incomplete clinical data, low RNA yields, a normal-like non-tumor expression profile, being part of the TL= lapatinib and paclitaxel arm, thus leaving 203 patients. Of these, 137 had DNA exomes results, with this final 137 sample set also being split into a training and test set. (B) Clinical and intrinsic expression subtype characteristics with pCR rates using the 137 patient data set. P-values were calculated by Chi-aquare test. TH, trastuzumab and paclitaxel arm; THL, trastuzumab, lapatinib and paclitaxel arm; ER, estrogen-receptor; PgR, progesterone receptor.
