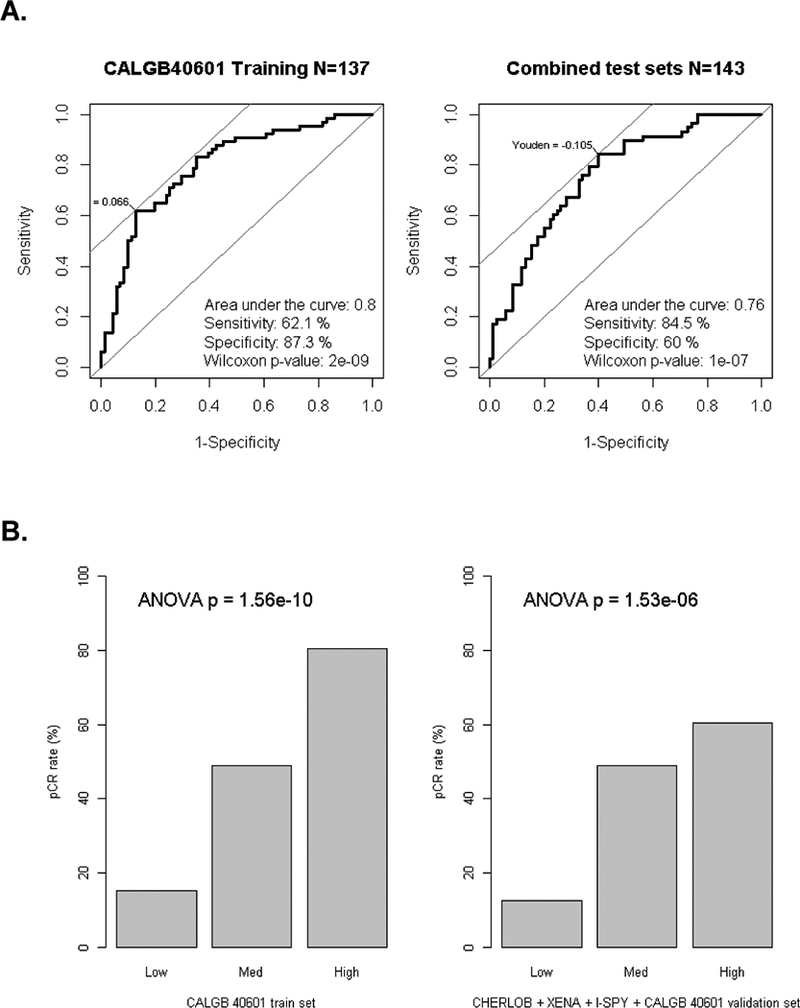
Figure 2. Performance of the Elastic Net model for pCR prediction using gene signatures on CALGB 40601.

(A) Area under the curve (AUC) from the Receiver operating characteristic curve analysis were estimated for Elastic Net models using gene signatures alone in CALGB 40601. Left, CALGB 40601 as the training set (N = 137), AUC = 0.80; Right, All test sets combined (CHERLOB + XENA + I-SPY + CALGB 40601 validation set, N= 143, AUC = 0.76). Sensitivity and specificity values were selected using Youden’s cutpoint where the sum of sensitivity and specificity is maximal. Mann-Whitney-Wilcoxon test was conduct to calculate p-values. (B) Barplots showing results of the Elastic Net model score split into three rank order groups and then comparing pCR rates for patients in CALGB 40601, or all test sets combined. ANOVA T-test was conducted to calculate p-values by comparing signature scores across all three groups.
