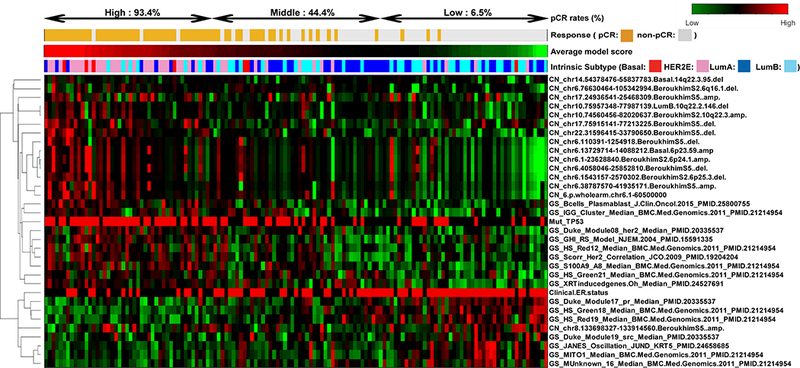
Figure 4. Hierarchical clustering of multi-dimensional features associated with pCR.

Supervised clustering of the 33 selected features among 137 samples. The features were grouped into two clusters with positive or negative predictors. The samples from left to right were ordered by their average scores derived from the 10 Elastic Net models grouped into high, middle, and low scores.
