
Figure 4.
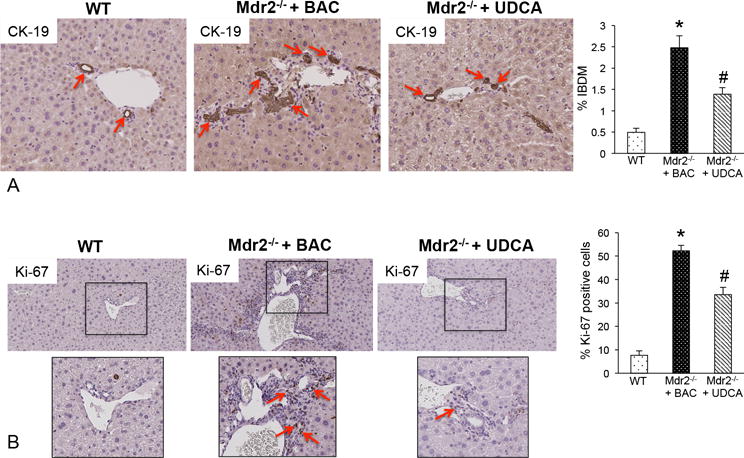
(A) Bile duct mass and (B) Ki-67 were evaluated in liver sections from WT, Mdr2−/− mice + BAC and Mdr2−/− mice fed UDCA. We found that bile duct mass (CK-19 staining, red arrows) and Ki-67 increased in Mdr2−/− mice fed BAC compared to WT mice, whereas in Mdr2−/− mice fed UDCA, there was decreased bile duct mass (red arrows) and a lower number of proliferating cholangiocytes (red arrows). Data has been semi-quantified and are expressed as mean ± SEM of at least 10 experiments. *p<0.05 versus WT mice; #p<0.05 versus Mdr2−/− mice fed BAC diet. Images are 20× magnification (inserts are 40× magnification).