
Figure 5.
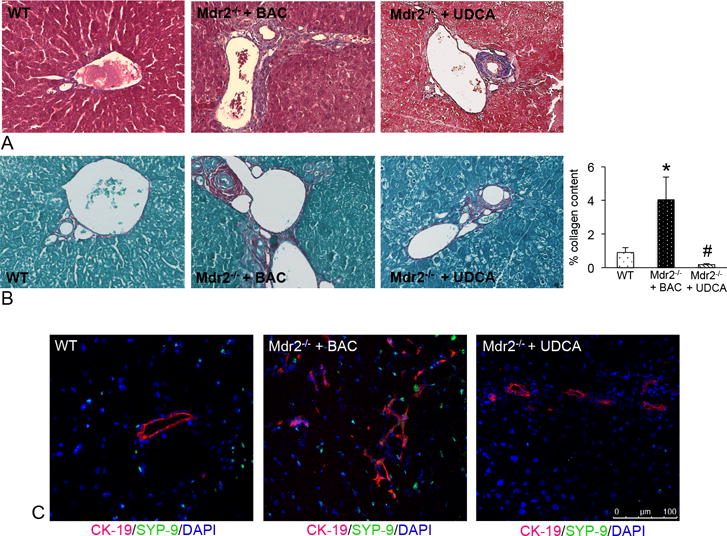
(A) Staining for Masson’s Trichrome and (B) Fast Green/Sirius Red demonstrate an increase in collagen content in Mdr2−/− mice fed BAC compared to WT. UDCA feeding decreased collagen content as shown by semi-quantification of Fast Green/Sirius Red staining (B). (C) Qualitative expression of SYP-9 (green staining) increased in Mdr2−/− mice fed BAC compared to WT; whereas, treatment with UDCA decreased qualitative SYP-9 expression (bile ducts are depicted by red staining). Data are expressed as mean ± SEM of at least 9 experiments. *p<0.05 versus WT mice; #p<0.05 versus Mdr2−/− mice fed BAC diet. Images are 40× magnification.