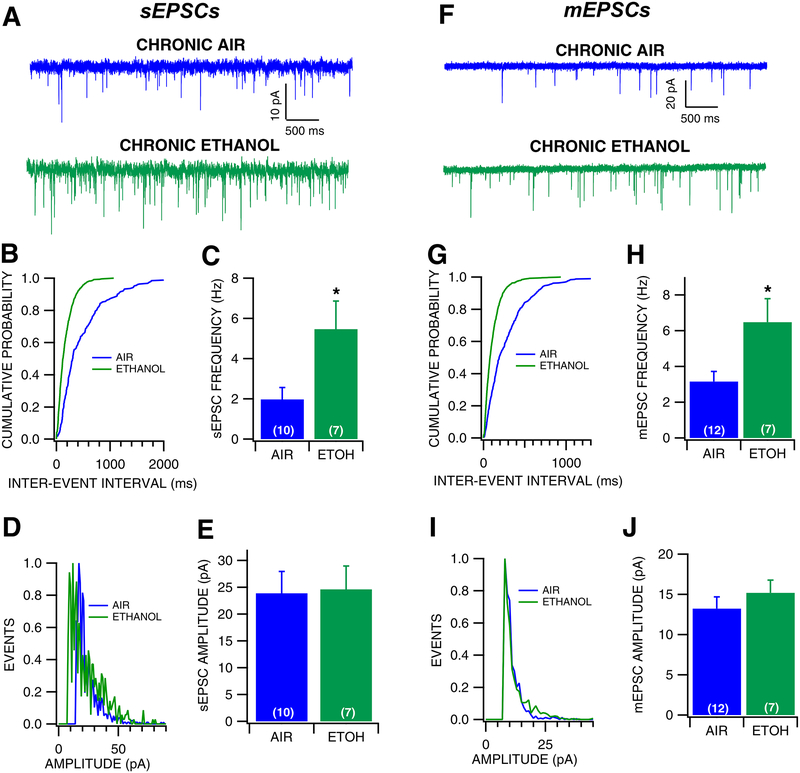
Figure 4: Effects of withdrawal from chronic ethanol vapor exposure on VTA GABA neuron EPSCs.
(A) Representative 5 sec traces of sEPSCs recorded from a VTA GABA neuron following chronic ethanol vapor or chronic air exposure. (B) Representative cumulative probability plot for sEPSC inter-event intervals following air vs ethanol exposure. (C) sEPSC frequency was significantly increased following chronic ethanol compared to chronic air exposure. (D) Representative histogram plot of sEPSC following air vs ethanol exposure. (E) There was no difference in sEPSC amplitude between chronic ethanol and chronic air conditions. (F) Representative traces of mEPSCs recorded from a VTA GABA neuron during withdrawal from chronic air vs ethanol vapor. (G) Representative cumulative probability plot for sEPSC inter-event intervals following air vs ethanol exposure. (H) mEPSC frequency was increased during withdrawal from chronic ethanol exposure compared to chronic air exposure. (I) Representative histogram plot of sEPSC following air vs ethanol exposure. (J) There was no difference in mEPSC amplitude during withdrawal from chronic air vs ethanol exposure. Asterisk *represents significance level p<0.05.

