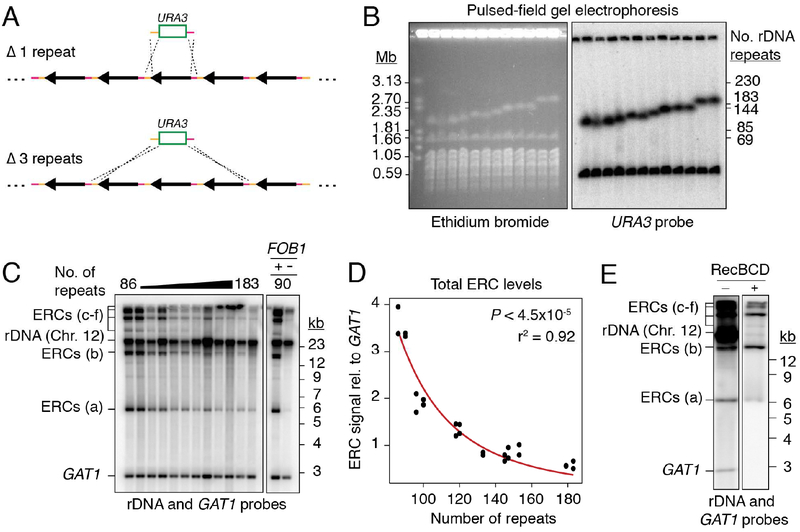
Figure 1: ERC levels anti-correlate with chromosomal rDNA array size.
(A) Random deletion of chromosomal rDNA repeats using a URA3-targeting plasmid containing homologies to the rDNA intergenic sequence (orange and pink). (B) PFGE analysis of deletion strains. Southern probe (URA3) detects the ura3 locus (Chr.5) and the URA3 insertion in rDNA (Chr. 12). (C) Southern analysis of ERCs probing against rDNA sequence and GAT1 (loading control) after digestion by AfeI. ERC signals labeled “a-f” based on electrophoretic mobility. (D) Total ERC signal (bands “a-e”) relative to GAT1 as function of array size; P < 4.5×10‒5 (Spearman’s rank correlation) and r2 fit to a power law function. Band f was not quantified due to proximity to wells, which is subjected to non-reproducible smearing and cracking during transfer. (E) Southern analysis of total ERCs with and without digestion by exonuclease RecBCD.

