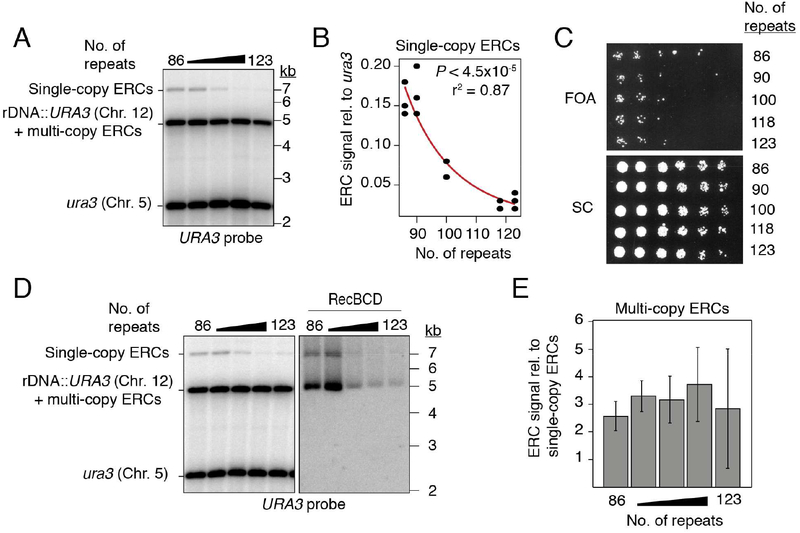
Figure 2: URA3-marked ERCs anti-correlate with array size, but not with marker loss.
(A-B) Southern analysis of URA3-marked ERCs as function of array size after digestion with NdeI. (C) 3.5-fold dilutions of rDNA deletion strains spotted onto synthetic complete (SC) media with and without 5-FOA. (D-E) Southern analysis of multi-copy, URA3-marked ERCs and quantification relative to single-copy ERCs. Data are represented as mean of n=3 clonal replicates ± standard deviation. Exonuclease RecBCD was used to digest linear DNA fragments, then heat inactivated before subsequent digestion with NdeI.

