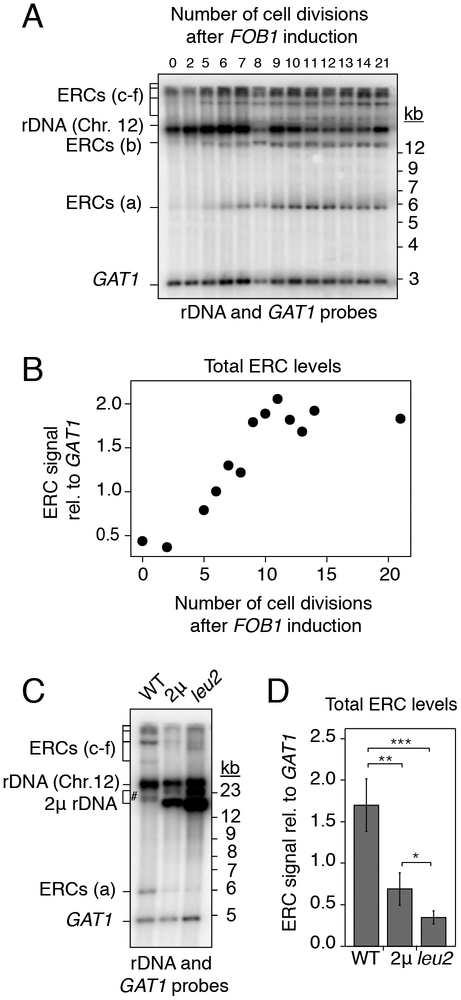
Figure 3: ERC accumulation responds to copy number.
(A-D) Southern analysis of ERCs in ~90-repeat strains. (A-B) Kinetics of ERC accumulation (bands a-e) relative to GAT1 after FOB1 induction with 100nM beta-estradiol. (C-D) ERC levels (bands a, c, d, e) relative to GAT1 after introduction of high-copy (2) rDNA plasmids or after further increasing plasmid copy number (leu2); ERC b (#) overlapped with plasmid signal and was not quantified. Data are represented as mean of n=4 biological replicates ± standard deviation. **P < 0.01, ***P < 0.001 (one-tailed t-test with Holm correction).

