
Figure 3. Cholinergic Signaling Directly Promotes Cell Proliferation in Kras Mutant Spheres via CHRM1 and Regulates Cancer Stemness.
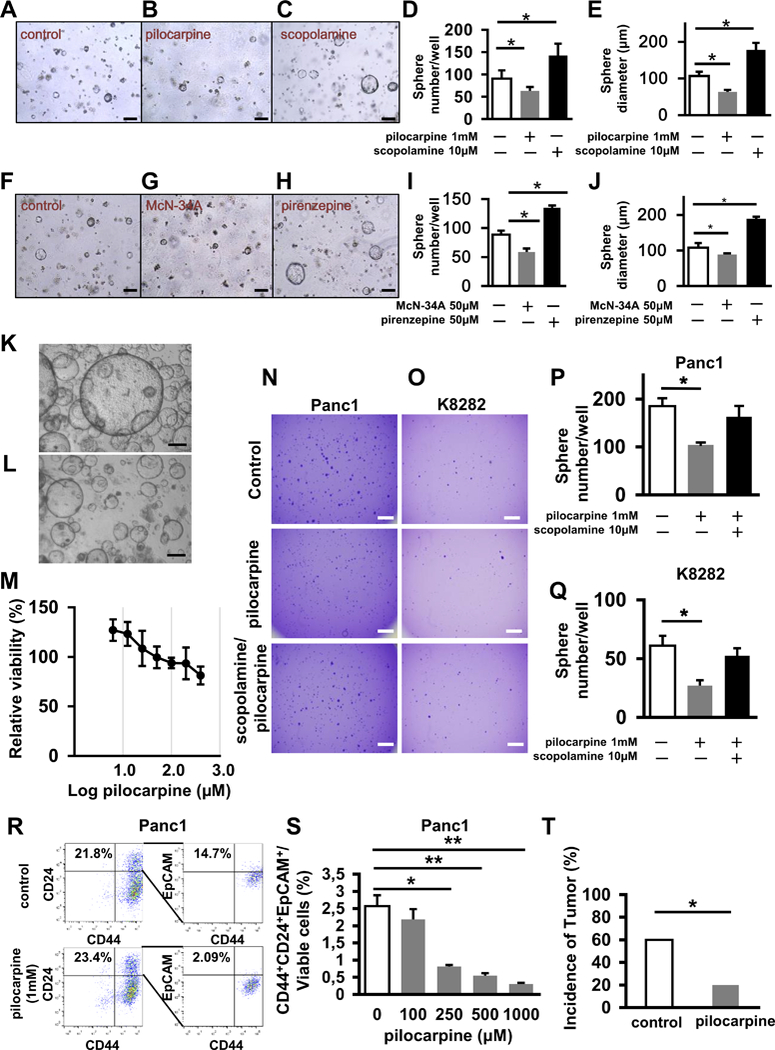
A-C. Representative images of pancreatic spheres isolated from LSL-Kras+/G12D mice and treated with an Adeno-Cre virus (A) or an Adeno-Cre virus and pilocarpine (B) or an Adeno-Cre virus and scopolamine (C). D and E. Number of spheres per well (D) and size of spheres (E) isolated from LSL-Kras+/G12D mice and cultured in the presence of an Adeno-Cre virus, which are untreated, treated with pilocarpine, or treated with scopolamine (n = 3, each group). F-H. Representative images of spheres isolated from LSL-Kras+/G12D mice and treated with an Adeno-Cre virus (F) or an Adeno-Cre virus and McN-34A (G) or Adeno-Cre virus and pirenzepine (H). I and J. Number of spheres per well (I) and size of spheres (J) isolated from LSL-Kras+/G12D mice and cultured in the presence of Adeno-Cre virus, which are untreated, treated with McN-34A, or treated with pirenzepine (n = 3, each group). K. Representative image of organoids generated from primary resected human PDAC specimen without treatment L. Representative image of organoids generated from primary resected human PDAC specimen treated with 100 μM of pilocarpine. M. Graph showing dose-dependent decrease in viability of organoids generated from primary resected human PDAC specimen on pilocarpine treatment. N. Representative images of spheres in soft agar from Panc1 cells that are untreated, treated by pilocarpine or treated by scopolamine and pilocarpine at day 14. O. Representative images of spheres in soft agar from K8282 cells that are untreated, treated by pilocarpine or treated by scopolamine and pilocarpine at day 14. P. Bar graph shows quantification of numbers of spheres from Panc1 cells plated in soft agar which are untreated, treated by pilocarpine or treated by scopolamine and pilocarpine at day 14 (n = 3, each group). Q. Bar graph showing quantification of numbers of spheres from K8282 cells plated in soft agar, which are untreated, treated by pilocarpine or treated by scopolamine and pilocarpine at day 14 (n = 3, each group). R. Flow cytometric analysis of CD44+CD24+EpCAM+ cells in Panc1 cells that are untreated, treated with pilocarpine. Numbers are showing the ratio of indicated cells to total cell number on the graphs. S. Bar graph shows quantification of CD44+CD24+EpCAM+ cells in Panc1 cells treated with different dosages of pilocarpine (n = 3). T. Percentage of NOD/SCID mice developing tumors 6 weeks after injection of 25,000 injected Panc1 cells with and without pretreatment with pilocarpine (n = 10, each group). Scale bars, 100 μm in Fig A-C and F-H, 500 μm in Fig K, L, N and O. Means ± SD in Fig D, E, I, J, M and T, Means ± SEM in Fig P, Q and S. *p < 0.05; **p < 0.01.