
Figure 6. Parasympathetic Signaling Influences Survival in a Model of Hepatic Metastasis.
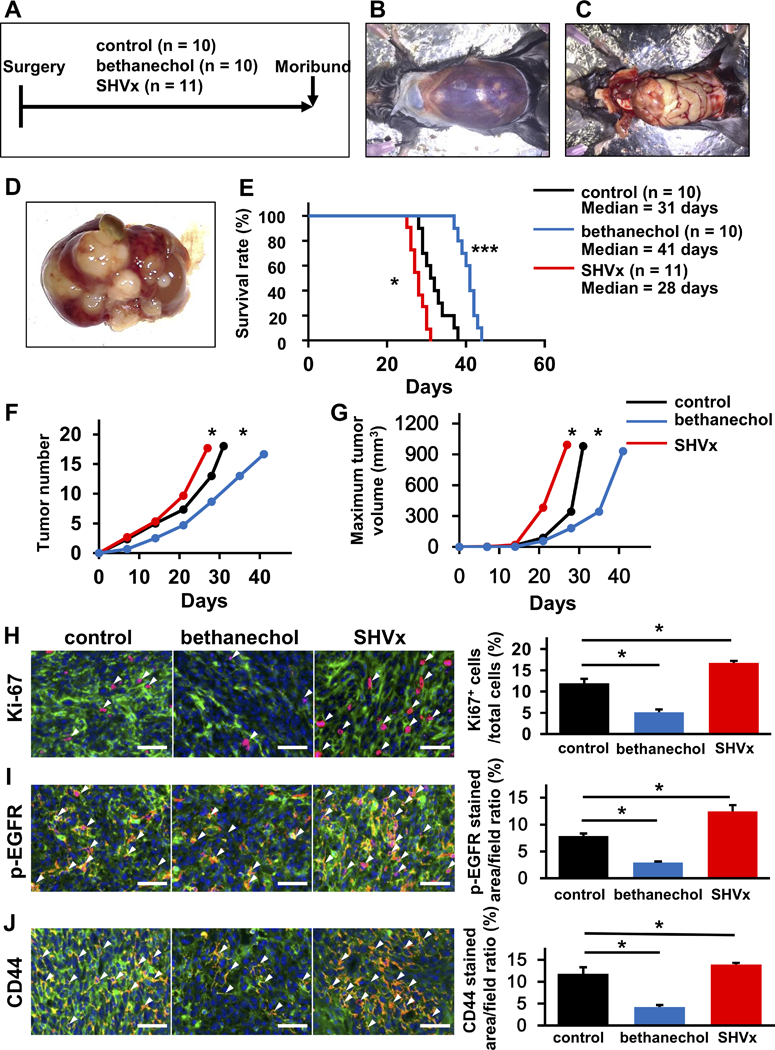
A. Experimental setup for the studies depicted in A-J. Wild-type C57BL/6 mice received splenic injections of 2×10⁶ GFP-labelled Panc02 cells and were then divided into 3 groups: untreated controls (n = 10), bethanechol-treated (n = 10), and selective hepatic vagotomy by transection of the hepatic branch of the vagus nerve (SHVx) (n =11). Mice were observed until they became moribund and needed to be sacrificed. B. Representative images at the time of necropsy. Mouse shows massive bloody ascites. C and D. Representative images showing cancer cells replacing the normal liver tissue as large pale nodules. E. Kaplan-Meier curve comparing overall survival after splenic injection of GFP-labeled Panc02 cells in control mice (black), mice with SHVx (red) or mice treated with bethanechol (blue). F. Tumor number at necropsy in mice that received SHVx (red) and bethanechol (blue), compared to untreated control (black). G. Tumor volume in mice that received SHVx (red) and bethanechol (blue) compared to untreated control (black). H-J. Representative images of immunofluorescent staining of liver metastases from untreated control, bethanechol-treated and SHVx mice for Ki-67 (Ki-67; red) (H), p-EGFR (p-EGFR; red) (I), and CD44 (CD44; red) (J). GFP; green, DAPI; blue, white arrowheads indicate red-positive cells). Bar Graphs show quantitative analysis of positive cells for each staining in untreated control, bethanechol-treated, and SHVx mice (n = 3, each group). Scale bars, 100 μm. Means ± SD. *p < 0.05; *** p < 0.001.