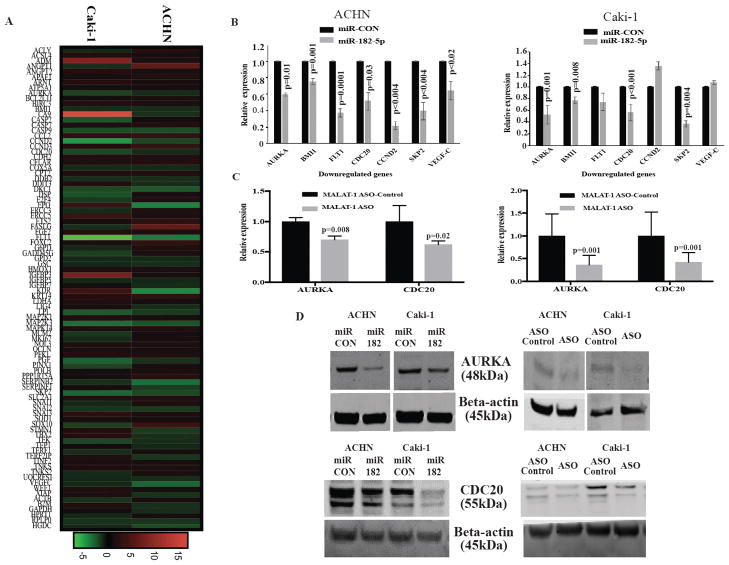
Figure 6.
miR-182-5p over-expression associated with mitotic progression of the cell cycle. A Heatmap generated from 84 key genes involved in cancer related pathways display the fold cahge for each gene in both Caki-1 and ACHN cells transfected with miR182-5p. Column represent individual cell line and each row represents individual assayed gene. Green represents downregulation of the gene and, red represents upregulation of gene . B qPCR analyses for some of the altered genes after miR-182-5p transfection in both Caki-1 and ACHN cells. C Decreased expression of AURKA and CDC20 in Caki-1 and ACHN cells after MALAT-1 ASO transfection at mRNA level. D Confirmation of decreased expression of AURKA and CDC20 at protein level in Caki-1 and ACHN cells after transfection with miR-182-5p mimic and MALAT-1 ASO transfection compared with respective controls. P-value calculated by Student t-test. Bar = mean± SE.

