Figure 3:
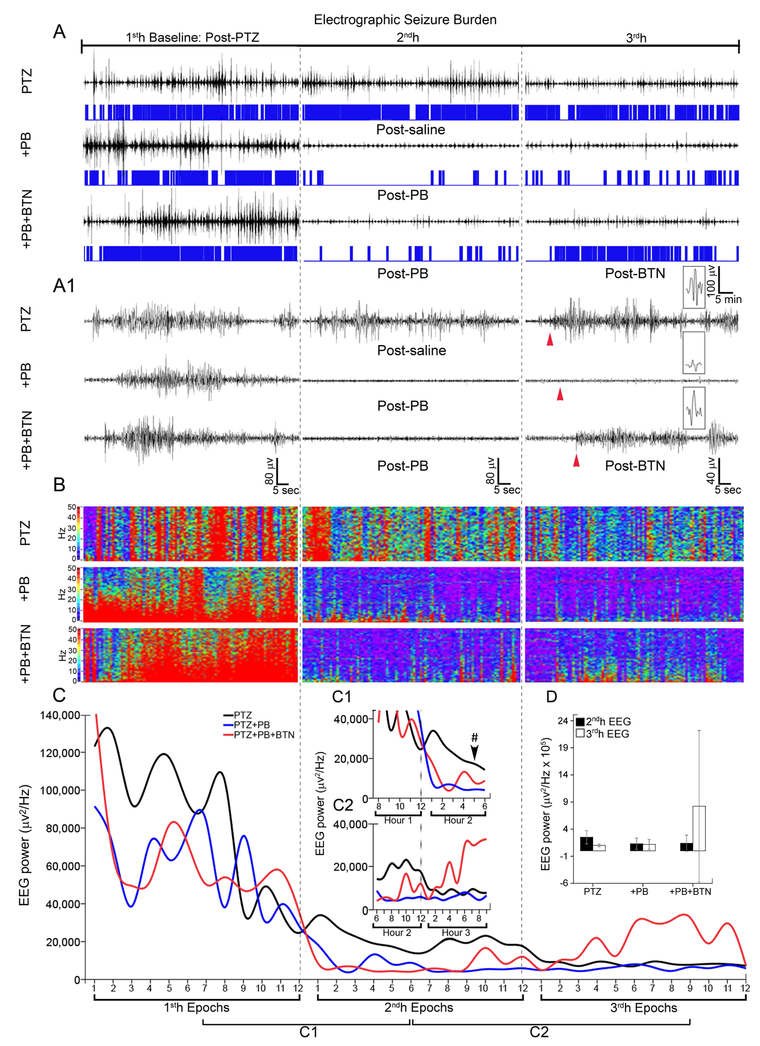
(A – A1) Representative electrographic traces of seizures recorded with scalp electrodes hourly plus frequency histograms (A) and 1 minute traces (A1) for PTZ, +PB, +PB+BTN treatment groups. (B) Representative heat maps for seizure burden show post-PB suppression and post-BTN aggravation, (C) Mean EEG power, epoch duration: 5 minutes showed an reduction of EEG power over 3h-recording period in all treatment groups (C1) EEG power suppression associated with efficacious PB treatment, not detected in PTZ only group (Hr2 Ep5 - #P=0.027, one-way ANOVA with Bonferroni post-hoc correlations). (C2) Post-BTN EEG power increase not detected in PTZ, +PB groups, however this increase was not significant. (D) Total calculated mean EEG power shows non-significant modulation because of large variability, indicating EEG power is not as reliable as EEG seizure burdens. Sample size: n=4 for PTZ group, n=8 for +PB group, n=9 for +PB+BTN group.

