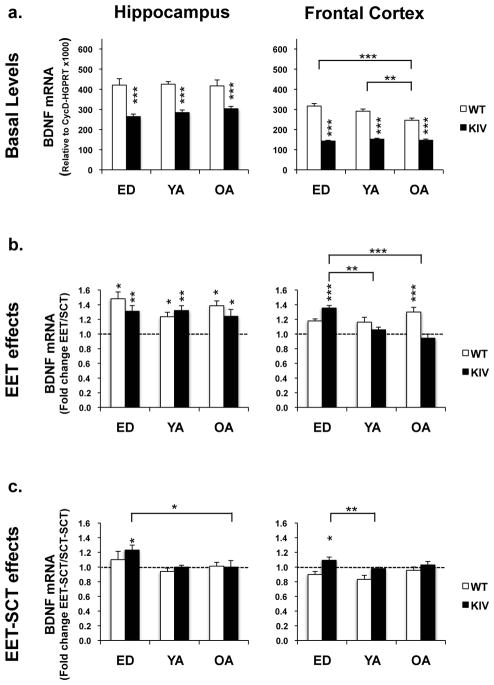
Fig. 2.
Total BDNF mRNA levels (the protein-coding exon IXc) in the hippocampus (left) and frontal cortex (right) at early-life development (ED), young-adult (YA), and old-adult (OA). a. Basal levels in standard conditions. Asterisks on the columns show significant differences between genotypes. N=14–16 per group. b. EET effects shown by fold changes of BDNF levels in mice with EET divided by those with SCT. Asterisks on the columns show significant BDNF induction in EET group compared to SCT group. N=6–8 per group. c. Lasting effects of EET shown by fold changes of BDNF levels in mice with EET and consequent SCT (EET-SCT) divided by levels in SCT mice (SCT-SCT). N=6–8 per group. *P<0.05; **P<0.01; ***P<0.005.

