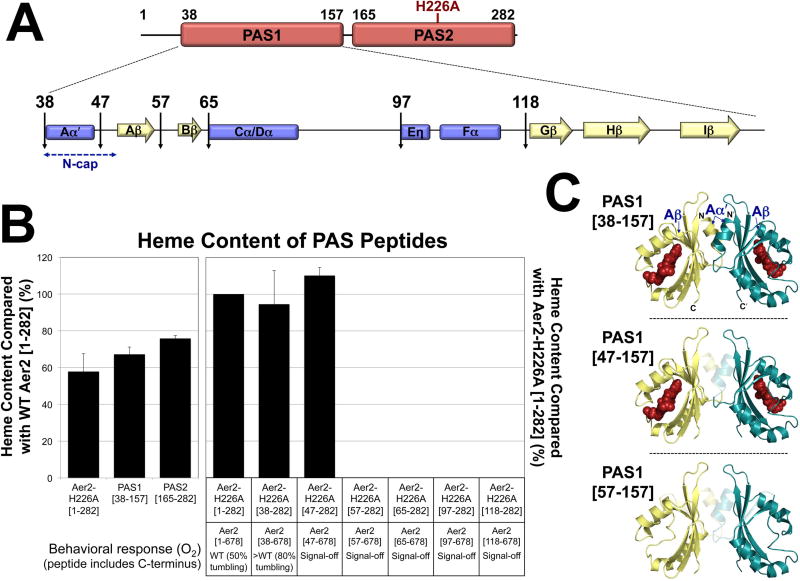
Fig. 5. Effects of N-terminal truncations on PAS1 heme binding and VcAer2 behavior.
A. Cartoon of PAS1-PAS2 (res. 1–282), the predicted secondary structure elements of PAS1, and locations of the N-terminal truncations.
B. Average heme content of PAS peptides, given as a percentage of the heme content in either WT VcAer2 [1–282] (left panel) or VcAer2-H226A [1–282] (right panel), corrected for peptide concentration. Error bars represent standard deviations from two to four experiments. The amount of heme bound to VcAer2-H226A [1–282] (i.e., heme bound to PAS1 in the presence of heme-less PAS2, left panel) is not significantly different from the amount of heme bound to PAS1 [38–157] (P = 0.3). The behavioral responses of BT3388 cells expressing VcAer2 mutants with N-terminal truncations are provided beneath the bar graph. The >WT mutant (VcAer2 [38–678]) exhibited ~80% tumbling in air compared with ~50% for WT VcAer2, whereas the signal-off mutants exhibited smooth-swimming behavior (2–5% tumbling) in both air and N2.
C. PAS1 dimer model based on the structure of P. aeruginosa Aer2 PAS (Airola et al., 2013a) showing the truncations that retained heme (top and center panels) and the shortest truncation that no longer retained heme (57–157, bottom panel). In each case, the translucent region represents the N-terminal residues (Aα′ helix, Aα-Aβ loop, and Aβ strand) that were sequentially deleted from PAS1.

