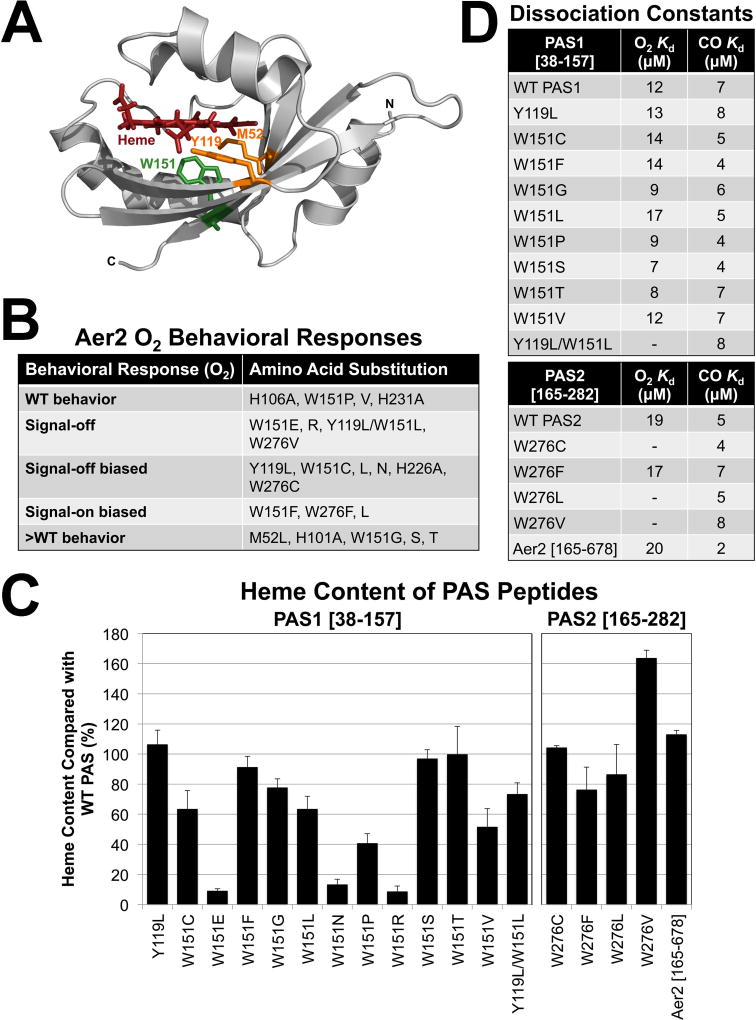
Fig. 6. VcAer2 PAS mutant behavior, heme content and gas-binding affinities.
A. The location of PAS1 residues M52, Y119 and W151 based on the structure of the P. aeruginosa Aer2 PAS domain (Airola et al., 2013a).
B. The behavior of full-length VcAer2 mutants in BT3388 compared with WT VcAer2 (which caused ~50% tumbling in air and ~2% tumbling in N2). Mutants with WT behavior exhibited 30–55% tumbling in air; signal-off mutants exhibited 2–5% tumbling in air; signal-off biased mutants exhibited 10–25% tumbling in air; >WT mutants exhibited 80–98% tumbling in air. All of these mutants exhibited ~2% tumbling in N2. In contrast, the signal-on-biased mutants caused 95–98% of cells to tumble in air, but had 20–50 sec delayed smooth-swimming (~2% tumbling, W151F and W276L) or incomplete smooth swimming (50–80% tumbling, W276F) responses in N2.
C. Average heme content of PAS peptides with amino acid substitutions, given as a percentage of WT PAS1 (left panel) or WT PAS2 (right panel) heme content, corrected for peptide concentration. VcAer2 [165–678] heme content is given as a percentage of full-length VcAer2 [1–678] heme content. Values below 15% indicate a substantial heme-binding defect. Error bars represent standard deviations from two to five experiments.
D. PAS peptide O2 and CO binding affinities. A dash indicates that O2-bound spectra were not observed, so no binding affinity was determined.

