
Figure 5 |. The extended αvβ3 integrin shows increased ability to mediate adhesion.
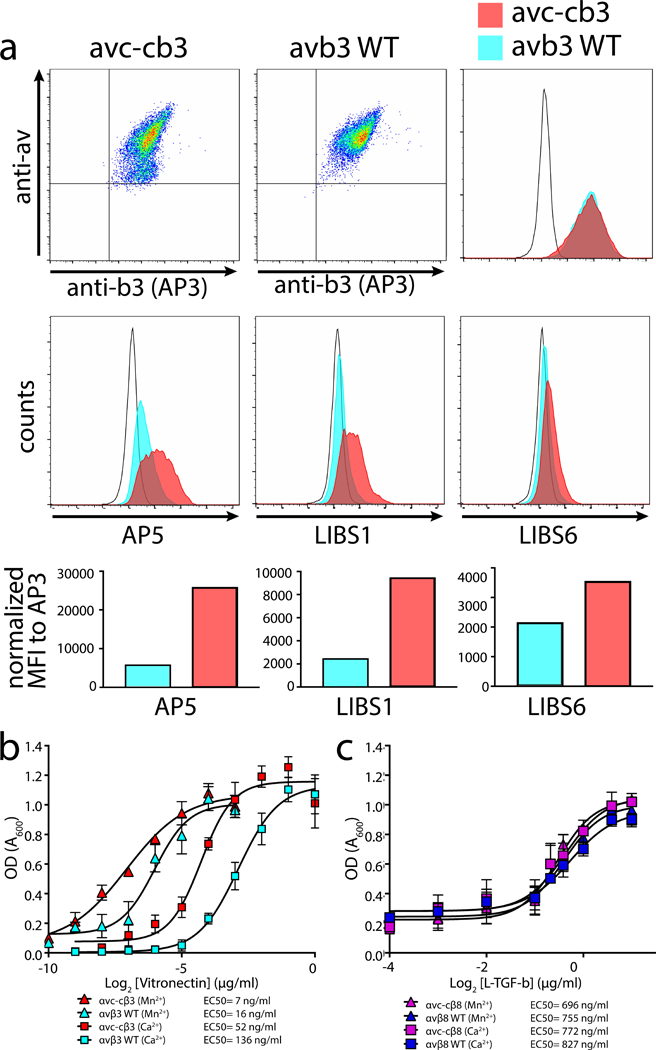
a, Expression of full-length human αvc-c (left upper panel) or αv (middle upper panel) paired with β3 in CHOLec 3.2.8.1 cells and detected using anti-human αv or anti-β3 (AP3) monoclonal antibodies, as indicated. Upper right, histogram overlay of β3 staining shows complete overlap of αvc-cβ3 (red) with αvβ3 (blue) compared to mock transfected CHOLec 3.2.8.1 cells (unfilled histogram). Middle panels, ligand-induced binding site (LIBS) antibodies staining sorted pools of αvc-cβ3 or αvβ3 shown in upper panels. AP5 (left), LIBS1 (middle), and LIBS6 (right) compared with mock transfected CHOLec 3.2.8.1 cells (unfilled histogram). Bottom panels show bar graphs of mean fluorescence intensity (MFI) of each antibody staining αvc-cβ3 or αvβ3 transfected CHOLec 3.2.8.1 cells. b, Adhesion assays of αvc-cβ3 or αvβ3 CHOLec 3.2.8.1 transfected cells to wells coated with vitronectin at various concentrations in the presence of basal (Ca2+) or activating cation conditions (Mn2+)(n = 3 independent experiment. Data and error bars represent mean ± s.e.m.). The data was subtracted by mock cell background adhesion. Legend shows the individual EC50 values. c, Adhesion assays of αvc-cβ8 or αvβ8 CHOLec 3.2.8.1 transfected cells to wells coated with L-TGF-β at various concentrations in the presence of basal (Ca2+) or activating cation conditions (Mn2+) (n=3 independent experiment. Data and error bars represent mean ± s.e.m.). The source data of the graphs shown in b and c is provided as supplementary material.