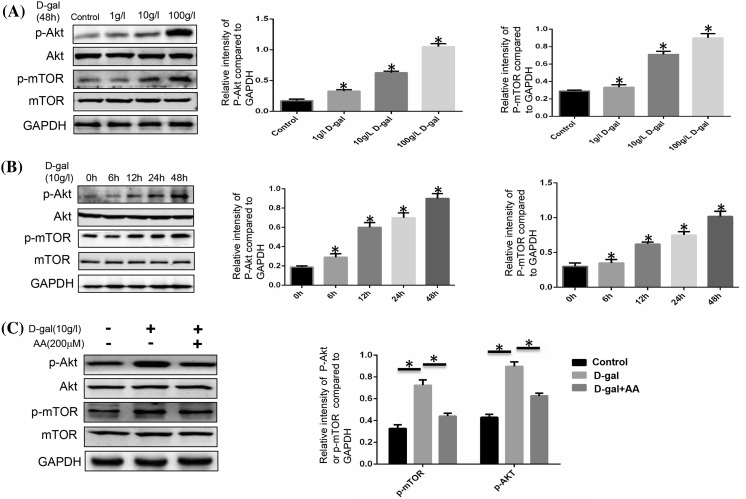
Fig. 5.
Expressions of AKT, p-AKT, mTOR, p-mTOR in BMSCs. a Western blot analysis. BMSCs were stimulated with different doses of d-gal for 48 h. The p-AKT and p-mTOR expression level was evidently higher as the dose increased (*P < 0.05). b Western blot analysis. BMSCs were stimulated with 10 g/l d-gal for different time. The p-AKT and p-mTOR expression level was evidently higher as time increased (*P < 0.05). c BMSCs were stimulated with 10 g/l d-gal and 200 μM ascorbic acid for 48 h. The higher expression of p-AKT and p-mTOR induced by d-gal was reduced when ascorbic acid was added (*P < 0.05). Results represent at least three independent experiments

