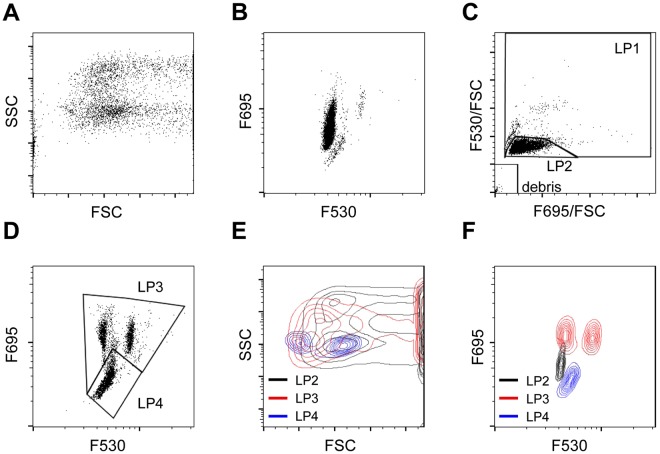
Figure 2.
Scattergram analysis of peripheral blood from X. laevis. (A) Scattergram indicates forward-scattered light (FSC) and side-scattered light (SSC). (B) Scattergram indicates the F530 and F695 fluorescence intensity. (C) X. laevis blood cell population LP1, LP2, and debris fractions developed based on the cellular red fluorescence intensity (F695/FSC) and cellular red fluorescence intensity (F530/FSC). (D) LP3 and LP4 were determined based on the F695 fluorescence intensity. (E) LP2, LP3, and LP4 were identified based on FSC and SSC. LP2 and LP3 partially overlapped, and LP4 completely overlapped with LP2 and LP3. (F) LP2, LP3 and LP4 were determined based on the F530 and F695 fluorescence intensity. LP2: Erythrocytes (grey); LP3: Granulocytes (Red); LP4: Lymphocytes and Thrombocytes (Blue).

