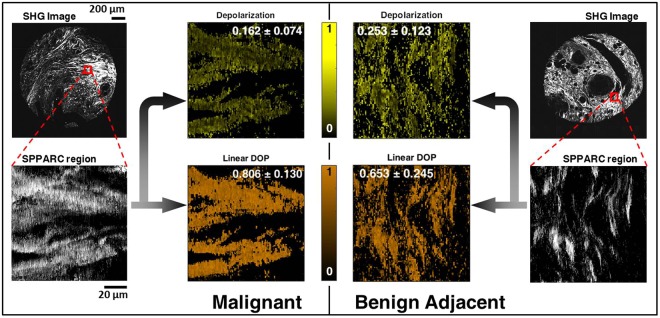
Figure 3.
Images of one selected region each from two TMA sample cores: one from an ILC core top left) and another from a BAT core (top right). SPPARC images for selected regions with stromal collagen within tumor for ILC and stromal collagen in benign tissue adjacent to tumor for BAT are shown. The corresponding depolarization and linear DOP parameter spatial maps are also shown (along with inset text showing mean and standard deviation over all pixels in the image) revealing a lower depolarization and higher linear degree-of-polarization for stromal collagen within tumor.

