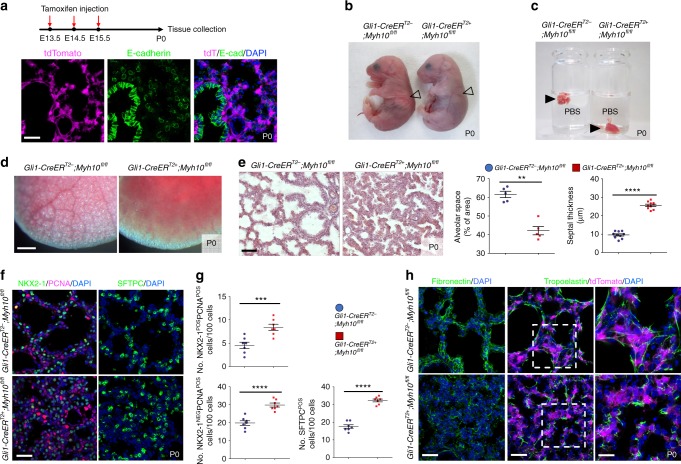
Fig. 5.
Mesenchyme-specific Myh10 deletion disrupts lung development. a Diagram indicating time points of tamoxifen injections and tissue collection. Immunostaining for E-cadherin in Gli1-CreERT2;ROSA26tdTomato P0 lungs. b Gross morphology of wild-type (n = 10) and Gli1-Myh10cKO (n = 8) P0 mice. Arrowheads point to inflated (left) and non-inflated lungs (right). c Floating assay for wild-type (n = 10) and Gli1-Myh10cKO (n = 8) P0 lungs. d Representative pictures of distal lung from wild-type (n = 10) and Gli1-Myh10cKO (n = 8) P0 mice. e H&E staining and morphometric analysis of alveolar space and septal thickness in wild-type (n = 10) and Gli1-Myh10cKO (n = 8) lungs at P0. f Immunostaining for NKX2-1, PCNA, and SFTPC in wild-type (n = 10) and Gli1-Myh10cKO (n = 8) P0 lungs. g Quantification of cell proliferation and differentiation in wild-type and Gli1-Myh10cKO P0 lungs. h Immunostaining for fibronectin, tropoelastin, and tdTomato in wild-type (n = 10) and Gli1-Myh10cKO (n = 8) P0 lungs. Error bars are means ± s.e.m. **P < 0.01, ***P < 0.001, ****P < 0.0001, two-tailed Student’s t-test. Scale bars: 500 μm (d), 50 μm (e), 30 μm (a, f, h (left, middle)), 15 μm (h (right))

