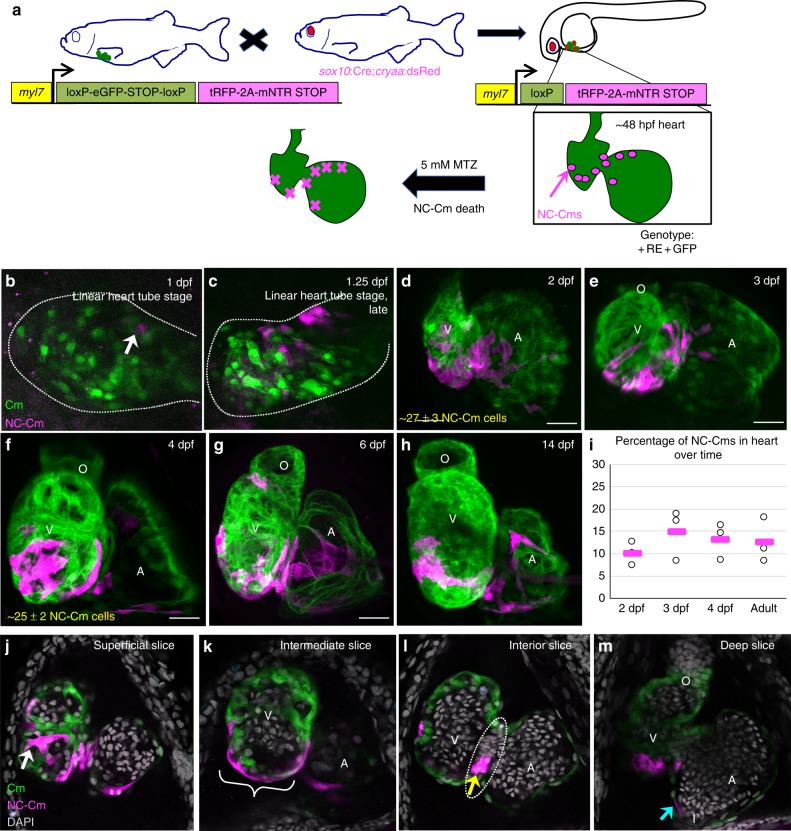
Fig. 1.
Mapping neural crest-derived cardiomyocytes (NC-Cms) during zebrafish heart development. a Schematic of the NC-Cm lineage labeling and ablation setup using the Cm:KillSwitch transgenic (myl7-driven transgene) crossed to the NC driver Tg(sox10:cre;cryaa:dsRed). Metronidazole (MTZ) treatment causes mNTR-expressing cells to die, i.e., NC-Cms switched to express tagRFP + and mNTR. b–h Contribution of NC-Cms to the developing heart over time. Confocal maximum intensity images of each development stage (1–14 dpf). On average, 27 ± 3 NC-Cms were found at 2 dpf, and this number did not significantly increase by 4 dpf (25 ± 2 NC-Cms). Quantification was from confocal 3D stack images at indicated timepoints and from three individuals. Dotted line outlines heart tube. Scale bar = 25 µm. i Graph displays percent of total cardiomyocytes that are tRFP + (i.e., NC-Cms). Cells were dissociated from isolated hearts at each of the indicated developmental stages and analyzed by flow cytometry. After live cell gating, the sum of GFP and RFP-positive counts was deemed as the total cardiomyocyte count. RFP counts divided by total cardiomyocyte count was used to compute percentages. Circles are biological replicates at each time point and bars are the average of replicates. j–m Confocal slices of a 4 dpf heart from NC-Cm lineage-labeled embryos. White arrow indicates trabeculating NC-Cm. Bracket denotes the apex of the ventricle. Dashed line encircles the AV canal and the yellow arrow indicates the couple of NC-Cms found on the outer curvature of the AV canal. Blue arrow indicates the NC-Cm found at the border of the inflow tract. O = outflow tract, V = ventricle, A = atrium. Scale bar is 30 µm. Images are representative of n ≥ 3

