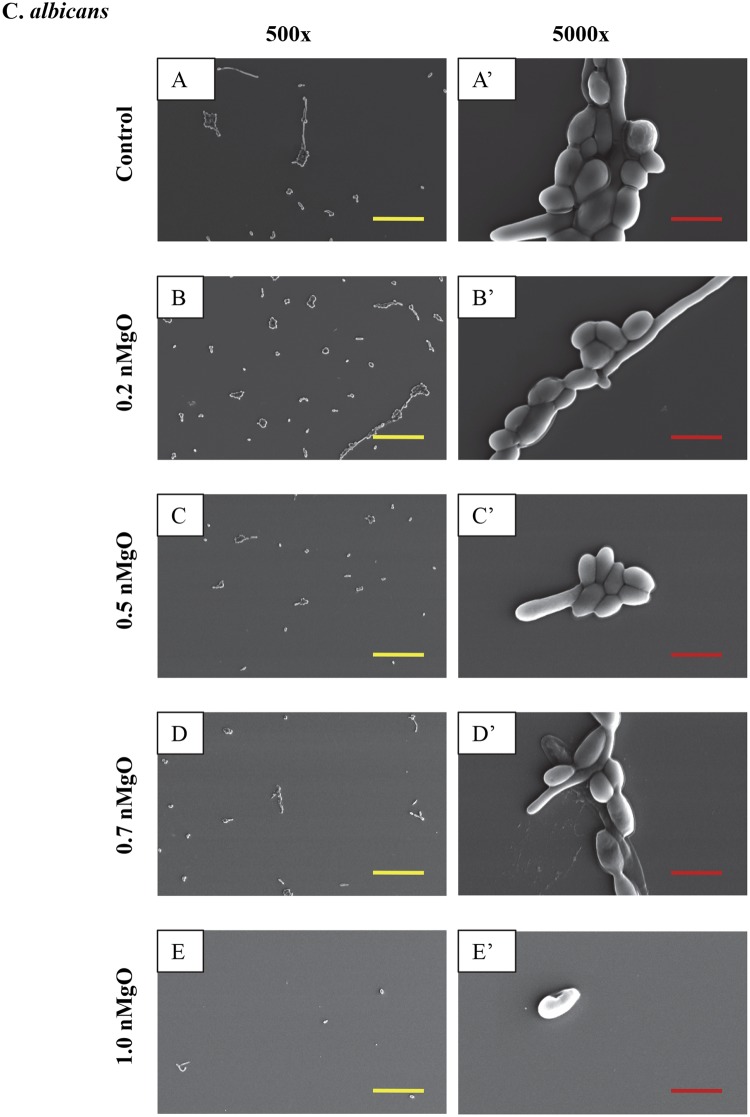
Figure 6.
SEM images of C. albicans, showing its morphology after 24 hours of culture with 0–2.0 mg/mL of nMgO. (A to E) Images at an original magnification of 500x with a scale bar of 50 µm. (A’ to E’) Images at an original magnification of 5000x with a scale bar of 5 µm. At 1.0–2.0 mg/mL of nMgO, the cell morphology was similar, and thus only one image at each magnification at 1.0 mg/mL of nMgO is shown as a representative for those at the higher nMgO concentrations.

