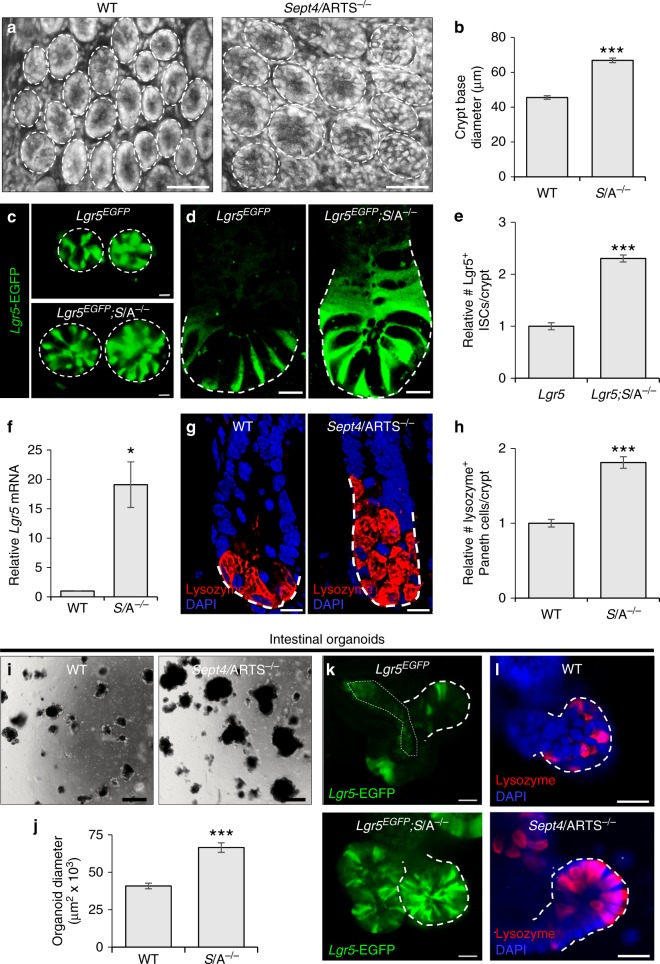
Fig. 2.
ARTS regulates expansion of the intestinal stem cell niche. a Control and Sept4/ARTS-deleted (S/A−/−) small intestinal wholemounts, viewed from the base of the crypt. Note the high presence of granularity in S/A−/− crypts, indicative of Paneth cells. Dashed white circles demarcate the crypt base circumference. b Quantification for wild-type (WT) and S/A−/− crypt base diameter measured from wholemount tissues. c Images of the crypt base in reporter mice shows enhanced numbers of Sept4/ARTS-deficient Lgr5-EGFP+ (Lgr5EGFP; S/A−/−) intestinal stem cells (ISCs). Dashed white circles demarcate the crypt base circumference. d Longitudinal sections of small intestinal crypts show that the Lgr5EGFP; S/A−/− crypt houses increased numbers of Lgr5-EGFP+ ISCs. Dashed white line demarcates the crypt base to the highest point of Lgr5-EGFP signal. e Relative number of Lgr5-EGFP+ ISCs per intestinal crypt in control and Lgr5EGFP; S/A−/− mice. f Real-time (RT)-PCR shows increased relative Lgr5 mRNA in S/A−/− intestinal tissue. g WT and S/A−/− intestinal crypts stained for lysozyme, marking Paneth cells. Dashed white line demarcates the crypt base to the highest point of lysozyme signal. h Relative number of Paneth cells per WT and S/A−/− crypt. i Brightfield images of organoids grown from isolated WT and S/A−/− crypts after 8 days in culture. j Quantification for maximum organoid size after 20 days in culture. k, l S/A−/− intestinal organoids display greater numbers of k Lgr5-EGFP+ ISCs and l lysozyme+ Paneth cells in organoid crypts. Dashed white lines demarcate organoid crypts. Images and quantitations are representative of n = 3 mice per genotype. All organoid experiments were performed on well triplicates generated from 3 pooled mice per genotype. RT-PCR experiments were performed on 3 pooled mice per genotype, analyzed in triplicates. P values were determined using two-tailed unpaired Student’s t test where *P < 0.05 and ***P < 0.001. Error bars represent ±s.e.m. All experiments were repeated at least twice. Scale bars: 10 µm (c, d, g), 20 µm (k, l), 50 µm (a), 500 µm (i)

