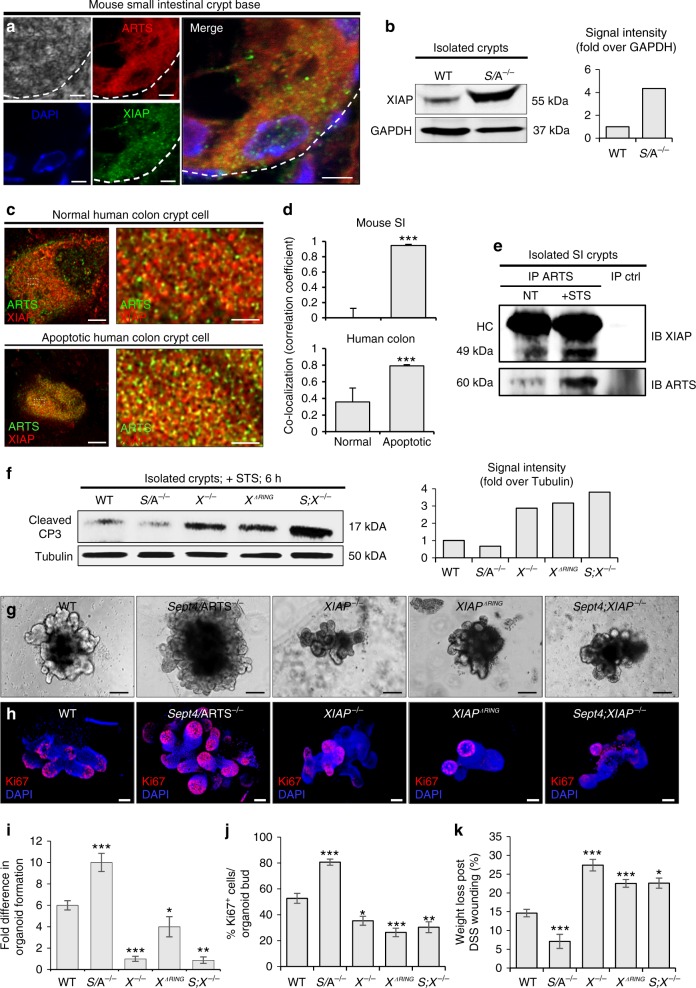
Fig. 8.
ARTS mediates its functions via interaction with XIAP in the intestinal crypt. a Confocal microscopy image of mouse small intestinal crypt base shows co-localization of ARTS and XIAP within the same cell [n = 4 mice]. b Western blot of XIAP in isolated wild-type (WT) and Sept4/ARTS−/− (S/A−/−) crypts. Signal intensity is normalized to GADPH. c Super-resolution stimulated emission depletion (STED) microscopy shows co-localization of ARTS and XIAP in normal and apoptotic human colonic crypt base cells. d Pearson’s coefficient values demonstrate higher co-localization of ARTS and XIAP in both mouse and human apoptotic crypt cells [n = 3 human colons and n = 4 mice. Error bars represent s.e.m.]. e Co-immunoprecipitation (co-IP) of ARTS and XIAP in isolated XIAPΔRING small intestinal crypts. XIAPΔRING only interacts mildly with ARTS in the absence of apoptotic stimulation. After staurosporine (STS) treatment, efficient binding between ARTS and XIAPΔRING is detected. f Western blot and signal intensity of active caspase-3 (CP3) in STS-treated crypts show that deletion of XIAP or RING domain increases cleaved CP3 levels. g Organoids derived from XIAP−/−, XIAPΔRING and S;X−/− crypts display hindered growth and development after 11 days post seeding. h XIAP−/−, XIAPΔRING and S;X−/− organoids stained for Ki67. i, j Fold difference in i organoid formation capacity and j number of Ki67+ cells in WT, S/A−/−, XIAP−/−, XIAPΔRING and S;X−/− organoids. k XIAP−/−, XIAPΔRING and S;X−/− mice display greater body weight loss than both WT and S/A−/− mice at 10 days following a 5-day DSS (2.5% w/v) regime [n = 3 mice per genotype]. All blots are representative of n = 3 pooled mice per genotype. Organoid data are representative of n = 3 pooled mice per genotype analyzed in well triplicates. P values were determined between each group or for each genotype compared to the WT control using unpaired two-tailed Student’s t test, where *P < 0.05, **P < 0.01, and ***P < 0.005. Error bars represent ±s.e.m., unless otherwise stated. All experiments were repeated at least twice. Scale bars: 1 µm (c right), 3 µm (c left), 5 µm (a), 100 µm (g, h)

