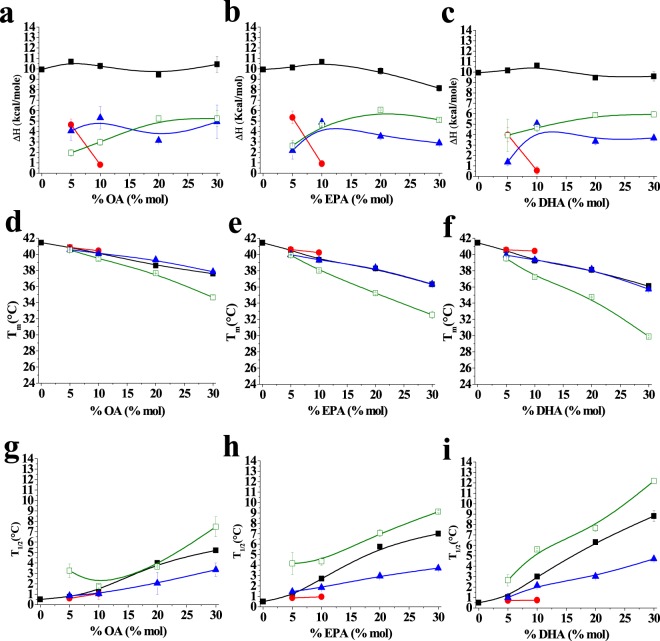
Figure 3.
(a–c) Enthalpy change (ΔH), (d–f) transition temperature (Tm), and (g–i) width at half-height (T1/2) mean values for each fitting component in the different mixtures. (a,d and g) show oleic acid containing mixtures; (b,e and h) show eicosapentaenoic acid containing mixtures and (c,f and i) show docosahexaenoic acid containing mixtures. Average ± S.D. of two independent liposome preparations. Sometimes the error bars are smaller than the symbols.

