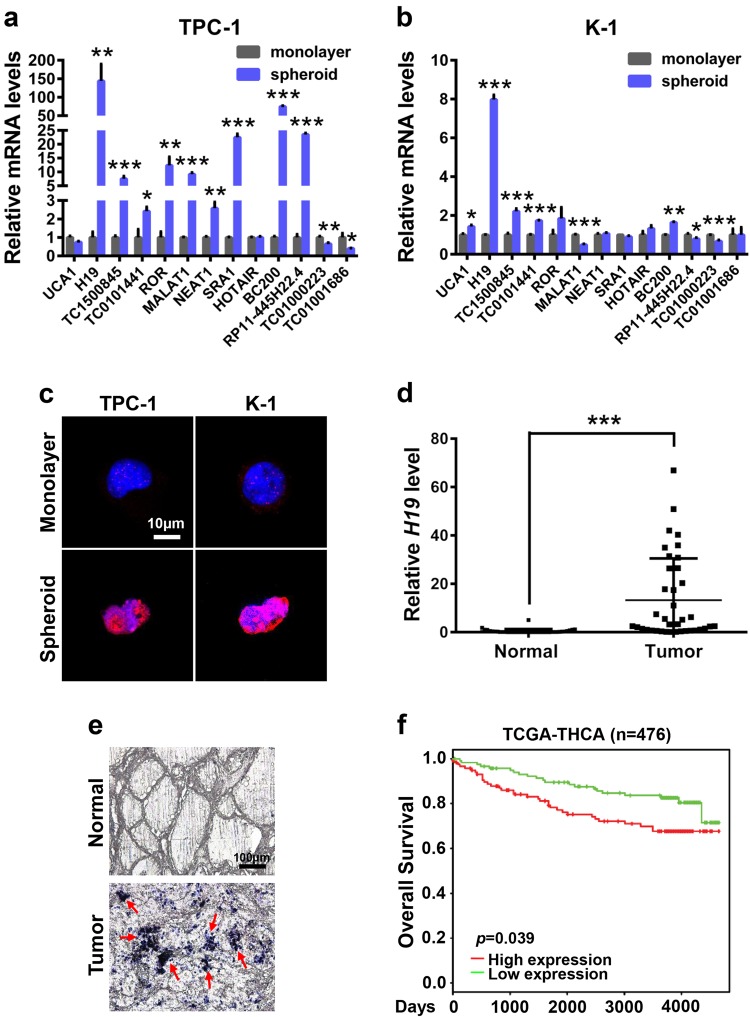
Fig. 2. H19 expression is elevated in PTCSCs and PTC tissue specimens.
a RT-qPCR analysis of the indicated lncRNA levels in the TPC-1 spheroid cells and TPC-1 monolayer cells. Data were shown as means ± SD (n = 3) *P < 0.05, **P < 0.01 and ***P < 0.001. b RT-qPCR analysis of the indicated lncRNA levels in the K-1 spheroid cells and K-1 monolayer cells. Data were shown as means ± SD (n = 3) *P < 0.05, **P < 0.01 and ***P < 0.001. c The in situ expression of H19 RNA was detected by FISH assay. The red fluorescent represents H19 RNA probe, and the blue fluorescent signal represents nuclear DNA counterstained with DAPI. The scale bar represents 10 μm. d H19 expression in PTC tissues and adjacent normal tissues were analyzed by RT-qPCR assay (n = 38). The relative H19 level was normalized to ACTB. The statistical difference was analyzed using the paired t-test. ***P < 0.001. e In situ analysis with a DIG-labeled H19 probe in PTC tissue specimens and adjacent normal tissue specimens. The scale bar represents 100 μm. f Kaplan–Meier overall survival plots of 476 thyroid cancer patients created using PROGgeneV2, data set from TCGA-THCA. Patients were classified into H19-high and H19-low subgroups and analyzed as indicated

