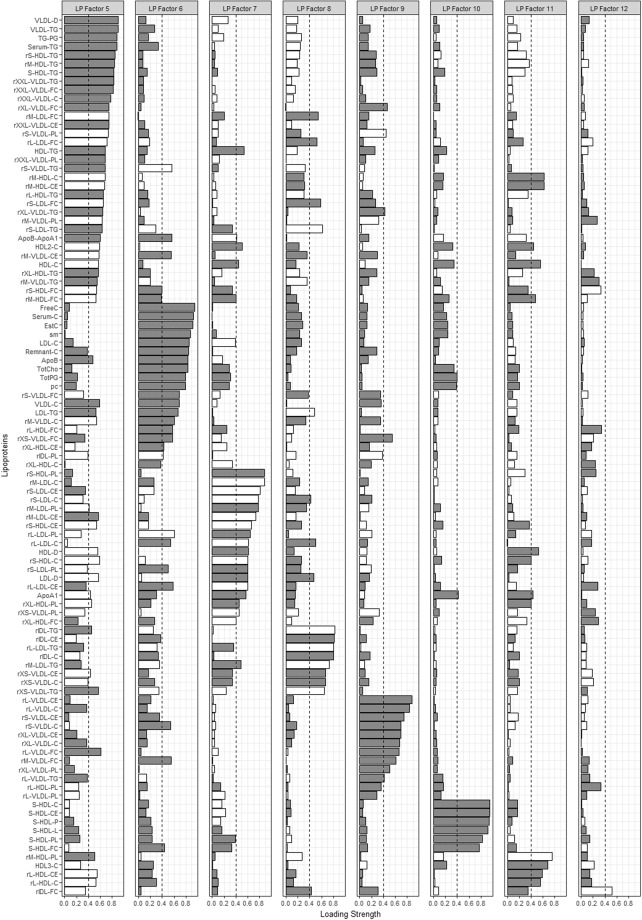
Figure 4.
Factor loading plot for lipoprotein factors 5–12. Grey bars indicate positive loadings, white bars indicate negative loadings, dashed lines indicate the threshold of 0.4 for identifying metabolites that load on a factor. r indicates lipid ratio, e.g. rM-VLDL-C is total cholesterol to total lipids ratio in medium VLDL. Abbreviations: C; cholesterol, CE; cholesterol ester, D; diameter, FC; free cholesterol, HDL; high density lipoprotein, IDL-intermediate density lipoprotein, L; lipids, LDL; low density lipoprotein, P; particles, PC; phosphatidylcholine, PG; phosphoglycerides, PL; phospholipid, SM; sphingomyelins, TG; triglyceride, VLDL; very low density lipoprotein.

