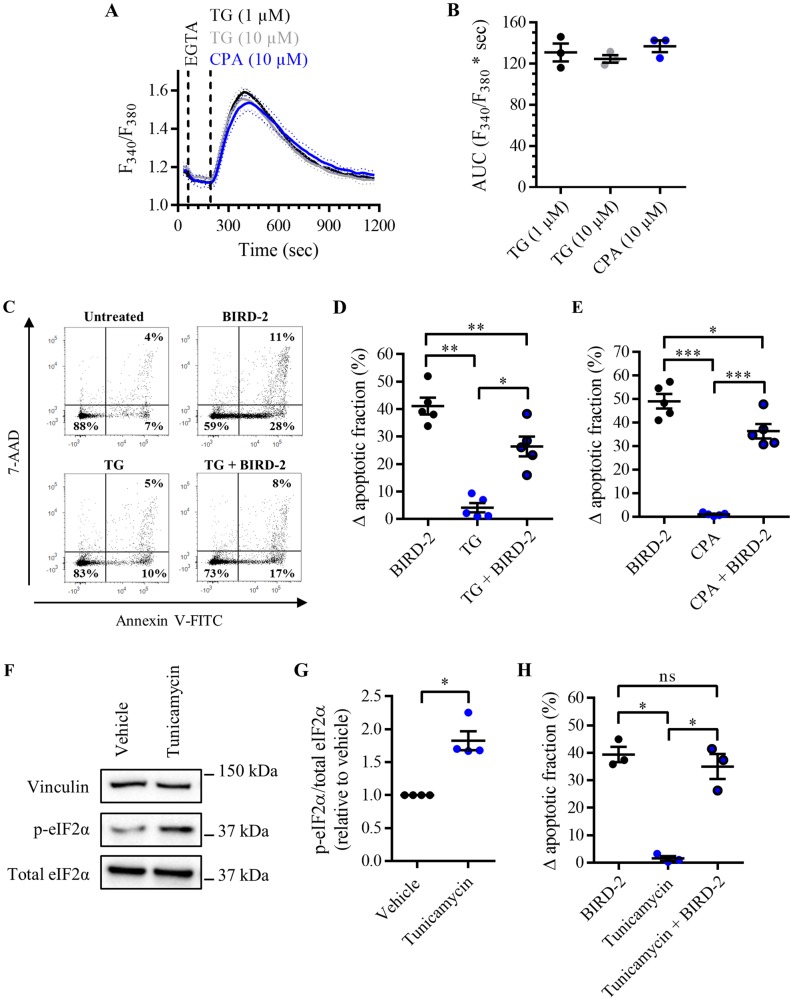
Fig. 7. BIRD-2-triggered apoptosis is reduced by depleting the ER Ca2+ store in SU-DHL-4 cells.
a Analysis of the cytosolic Ca2+ response in SU-DHL-4 cells using Fura-2 AM. After the addition of 3 mM EGTA, 1 or 10 µM TG or 10 µM CPA were added to deplete the ER Ca2+ store. The curves represent the mean ± SEM of three independent experiments. The TG/CPA-releasable Ca2+ is quantified by measuring the AUC (F340/F380 × s), which is shown in b. c Representative scatter plots from flow cytometry analysis detecting apoptosis in SU-DHL-4 cells stained with Annexin V-FITC and 7-AAD. Cells were pre-treated with or without 1 µM TG 30 min prior to application of 10 µM BIRD-2. After 2 h of BIRD-2 treatment, apoptotic cell death was detected by measuring the Annexin V-FITC-positive fraction. d Quantitative analysis of five independent experiments detecting apoptosis in SU-DHL-4 cells treated for 2 h with 10 µM BIRD-2, with or without a pre-treatment of 30 min with 1 µM TG. e Quantitative analysis of five independent experiments detecting apoptosis in SU-DHL-4 cells treated for 2 h with 10 µM BIRD-2, with or without a pre-treatment of 30 min with 10 µM CPA. f A representative western blot of four independent experiments showing the expression levels of total eIF2α and p-eIF2α in SU-DHL-4 cells treated for 4 h with 5µg/ml tunicamycin. The expression level of vinculin was used as a loading control. g Quantification of the p-eIF2α/total eIF2α-protein levels in SU-DHL-4 relative to vehicle-treated cells, which was set at 1. h Quantitative analysis of three independent experiments detecting apoptosis in SU-DHL-4 cells treated for 2 h with 10 µM BIRD-2, with or without a pre-treatment of 4 h with 5µg/ml tunicamycin. In d, e, and h the ∆ apoptotic fraction is plotted, which corresponds to the apoptotic fraction corrected for the percentage of apoptosis detected in untreated cells. In the dot plots, data are represented as the mean ± SEM of at least three independent experiments. Statistically significant differences were determined with a one-way ANOVA (*p < 0.05, **p < 0.01, ***p < 0.001). NS not significant

