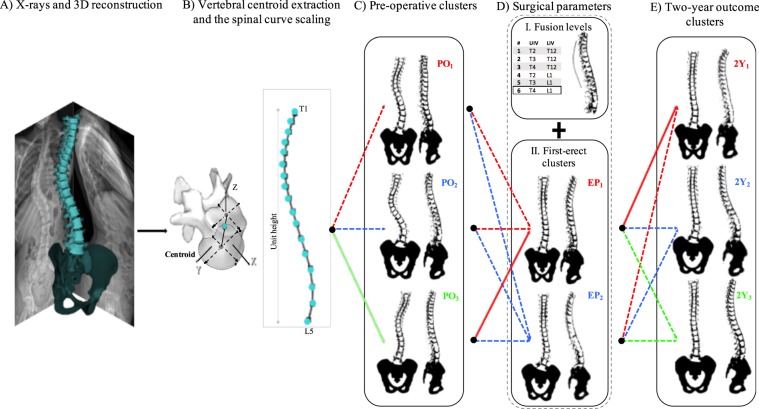
Figure 1.
The framework for 3D classification, path assignment, and outcome determination: (A) the 3D reconstruction of the spine from bi-planar X-rays is generated. (B) The vertebral centroids are calculated. The spline is generated by linearly interpolating the T1 to L5 spinal vertebral centroids 3D positions and is scaled in all directions (i.e., isotropically) such that the unit height is achieved. (C) K-means clusters are used to group the pre-operative (PO) 3D scaled spinal curves. Three clusters are identified in our cohort (see Methods). (D) I. Fusion levels (F) are specified based on the position of the upper and lower fused vertebrae (UIV and LIV). Six fusion levels are identified in our cohort. II. K-means clusters are used to group the early post-operative (EP) 3D scaled spinal curvatures. Two clusters are identified in our cohort. (E) K-means clusters are used to group the 3D scaled spinal curves at two-year follow-up (2Y). Three clusters are identified in our cohort. The assigned treatment path for one patient has been shown with solid lines, indicating that PO3-EP1-F6 path leads to 2Y1 cluster at two-year follow-up (see Methods). The sagittal, frontal, and axial views of the PO, EP, and 2Y clusters are shown in Fig. 3. The 3D shapes of these clusters are shown in Fig. 4.

