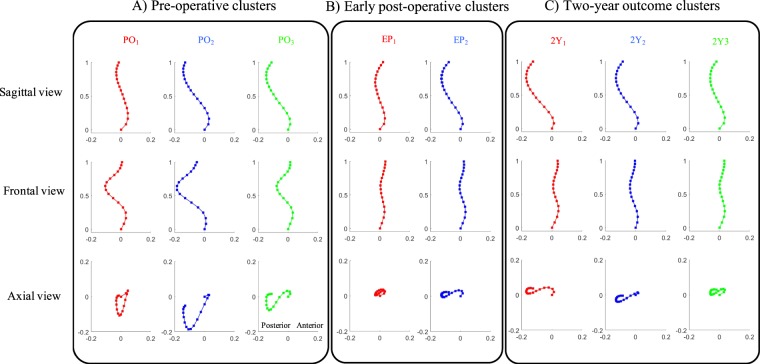
Figure 3.
Groups identified using the K-means clustering analysis of the 3D spinal curvatures at three different time-points. The projections of the cluster centers of the spinal curves are shown in the sagittal, frontal, and axial planes for cluster 1 (red), cluster 2 (blue), and cluster 3 (green) at three different time-points (A) The pre-operative (PO), (B) early post-operative (EP), and (C) two-year outcome (2Y). The PO 3D curve patterns are characterized as follows. These characteristics were in the sagittal view cluster 1: hypokyphotic range with no proximal kyphosis, cluster 2: normal-hypokyphotic range with no proximal kyphosis and a high inflection point (T11), cluster 3: normal-hypokyphotic range with proximal kyphosis and a lower level inflection point (L1). In frontal view cluster 1: balanced, cluster 2: unbalanced, and cluster 3: balanced. In the axial view cluster 1: closed V shape, cluster 2: V shaped, and cluster 3: S shaped. The two EP clusters in the three views are shown in (B). The sagittal characteristics of cluster 1 are flat, and of cluster 2 are normal-hypo kyphotic range with proximal kyphosis and a low-level inflection point (L1). The Frontal characteristics are as follows. Cluster 1: lateral shift and cluster 2: balanced. The axial characteristics are cluster 1: closed loop, cluster 2: S shape. The sagittal characteristics are: cluster 1: hyperkyphosis backward shift, for cluster 2: normal-hypo kyphotic, and for cluster 3: flat. The frontal characteristics are cluster 1: unbalance, cluster 2: balance, and cluster 3: unbalance. The axial characteristics are cluster 1: S shaped, cluster 2: S shaped, cluster 3: S shaped-closed.

