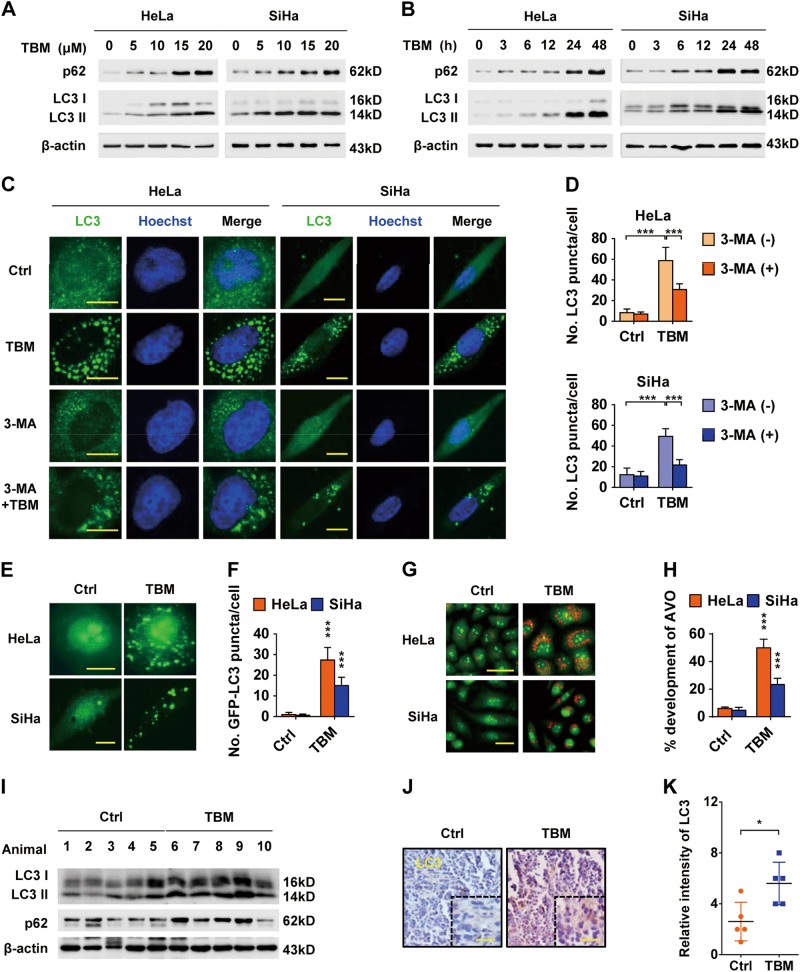
Fig. 3. TBM initiates autophagosome formation in cervical cancer cells.
a Immunoblot analysis of LC3 and p62 in HeLa and SiHa cells treated with indicated concentrations of TBM for 24 h. b Immunoblot analysis of LC3 and p62 in HeLa and SiHa cells treated with 15 μM TBM for indicated time. c Immunofluorescence analysis of endogenous LC3 puncta formation in TBM-treated HeLa and SiHa cells in present with or without 3-MA for 24 h. Scale bar: 20μm. d Graph shows quantification of LC3-positive punctate cells in (c). e HeLa and SiHa cells were transfected with GFP-LC3 for 48 h, and then treated with 15 μM TBM for another 24 h. GFP-LC3 puncta was visualized by immunofluroescence. Scale bars: 20μm. f Graph shows quantification of GFP-LC3-positive punctate cells in (e). g Acridine orange was used to stain acidic vesicular organelles in HeLa and SiHa cells treated with 15 μM TBM. Scale bars: 50 μm. h The total number of acidic vesicular organelles (AVO) per cell in Figure G was quantified by ImageJ software. i Tumor tissues were hydrolyzed, and then LC3 and p62 were examined by immunoblot. j–k Tumor tissues were resectioned and subjected to immunohistochemistry for evaluating expression of LC3 in mouse tumor xenograft. Scale bars: 100 μm. *p < 0.05; ***p < 0.001

