Fig. 2.
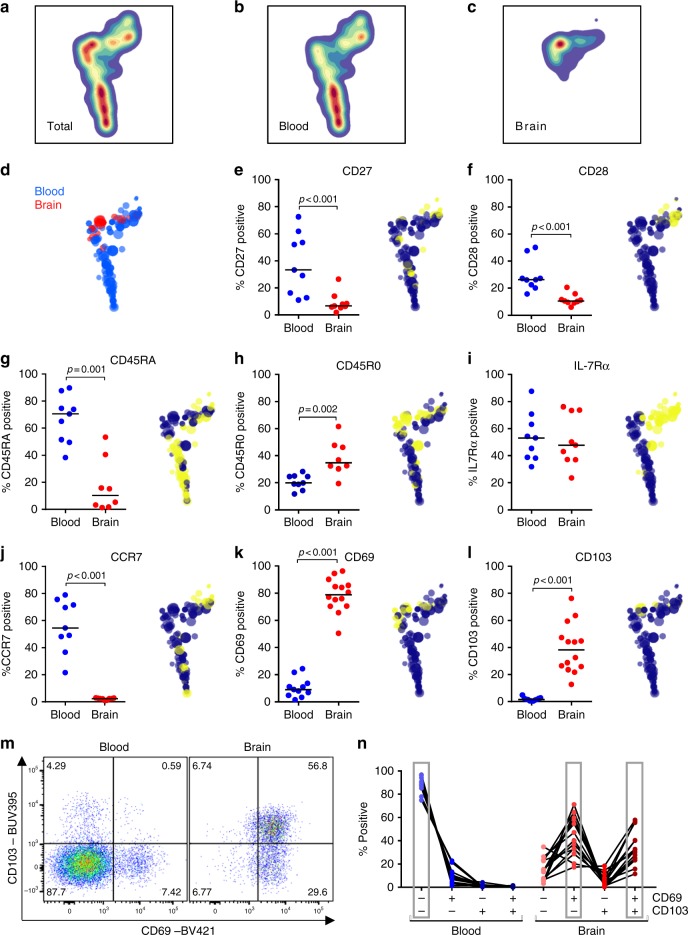
Human brain CD8+ T cells express the tissue residence markers CD69 and CD103. a–c HSNE plot of paired brain-derived and blood-derived CD8+ T cells of n = 5 donors, based on expression of markers shown in this figure, as well as KLRG1 and GPR56, shows segregated clustering of blood-derived and brain-derived CD8+ T cells. d Distribution of hierarchical clusters in the HSNE plot with the size of the dots indicating hierarchical cluster size. e–l Quantification of CD8+ T cells expressing CD27, CD28, CD45RA, CD45R0, IL-7Rα, CCR7, CD69, and CD103, respectively. In the HSNE plots, yellow dots indicate positive and blue dots negative hierarchical clusters. Clustering of brain CD8+ T cells is most prominently characterized by high expression of CD69 and CD103. Bars show median values. p-values show Mann–Whitney U test; no brackets indicate no significant difference. m Dot plot of CD69 and CD103 co-expression in CD3+CD8+ T cells eluted from blood and brain. n Co-expression of CD69 and CD103. The dominant phenotype was CD69−CD103− in blood and CD69+CD103− and CD69+CD103+ in brain

