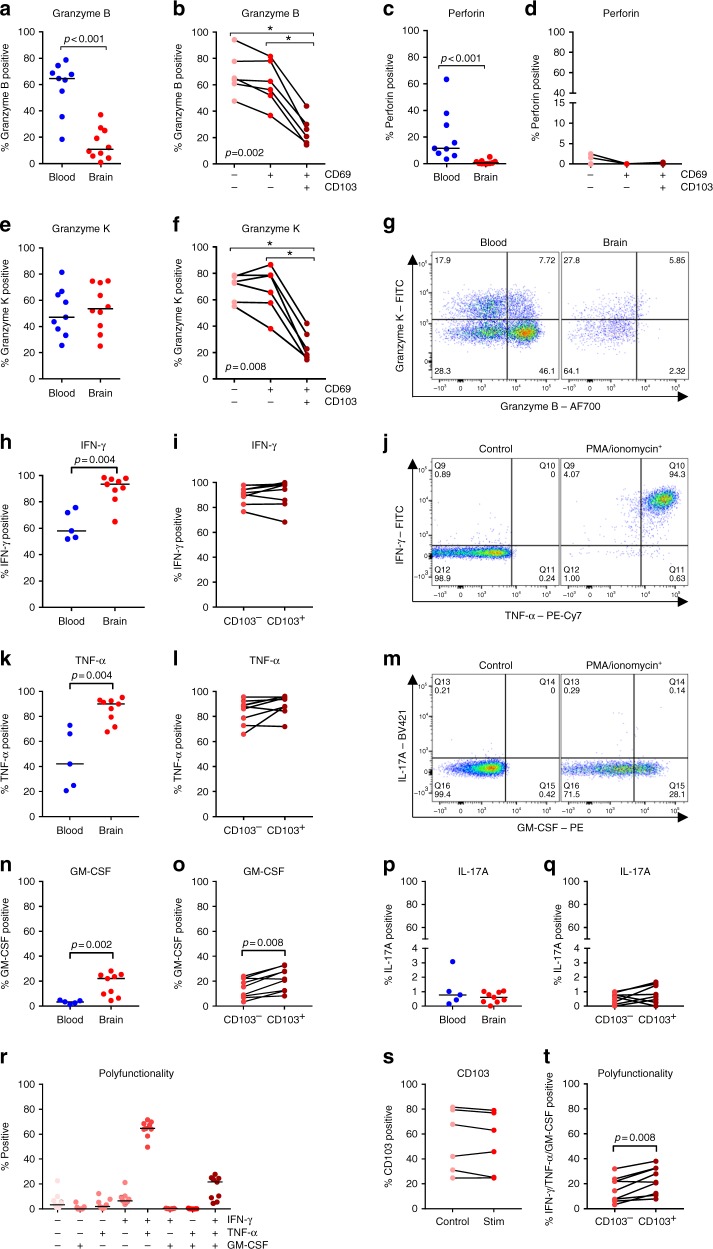
Fig. 6.
CD103+ brain CD8+ T cells express few cytolytic enzymes but show a polyfunctional cytokine profile. a–f Quantification of the percentage of brain CD8+ T cells directly ex situ expressing granzyme B, perforin, and granzyme K, respectively. g Representative dot plots of CD3+CD8+ T cells stained for granzyme B and granzyme K. h–i, k–l, n–q Quantification of the percentage of brain CD8+ T cells positive for IFN-γ, TNF-α, GM-CSF, and IL-17A after stimulation with PMA/ionomycin in vitro. j, m Dot plot of PMA/ionomycin-stimulated CD3+CD8+ T cells stained for the respective cytokines. r Quantification of IFN-γ, TNF-α, and GM-CSF co-expression, t stratified for expression CD103. s CD103 expression in brain CD8+ TRM control and PMA/ionomycin-stimulated cells. p-values show Mann–Whitney U test (a, c, e, h, k, n, p), Friedman test for paired data with Wilcoxon signed ranks as post hoc test (b, d, f), or Wilcoxon signed ranks test (i, l, o, q, s, t) (*p < 0.05, **p < 0.01); no brackets indicate no significant difference

