Fig. 8.
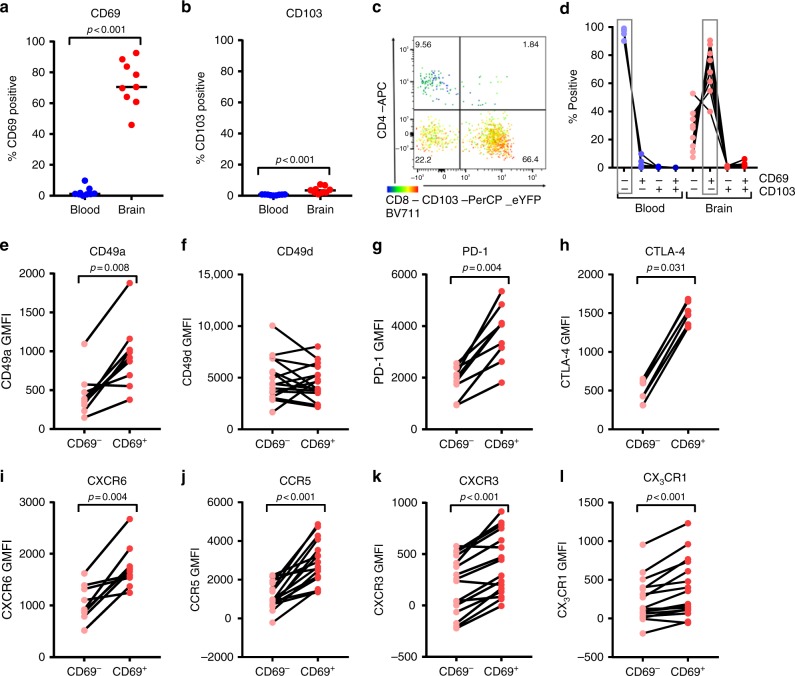
Human brain CD4+ CD69+ T cells are enriched for core phenotypic TRM-cell markers. a, b, d Quantification of CD69 and CD103 (co-)expression. p-values show Mann–Whitney U test. c Representative dot plot of CD4, CD8, and CD103 staining of brain CD3+ CD69+ T cells. d Co-expression of CD69 and CD103. The dominant phenotype was CD69−CD103− in blood and CD69+CD103− in brain. e–l Quantification of CD4+ T-cell expression levels of CD49a, CD49d, PD-1, CTLA-4, CXCR6, CCR5, CXCR3, and CX3CR1 (GMFI, geometric mean fluorescence intensity). p-values show the Wilcoxon signed ranks test

