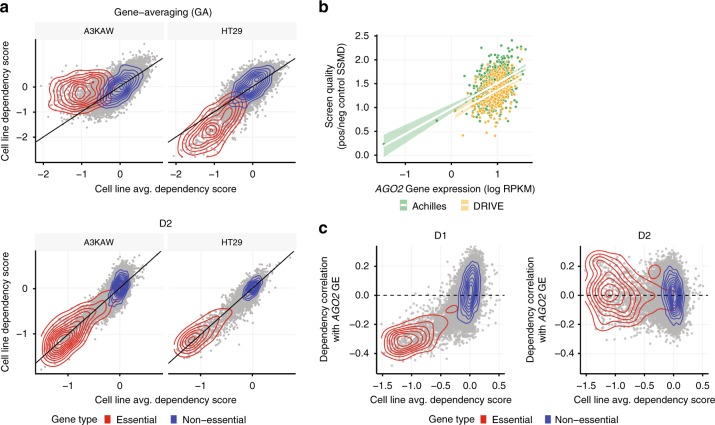
Fig. 2.
D2 corrects biases related to variable screen quality. a Comparison of across-cell-line average gene dependency scores with scores estimated for individual example low- (left) and high- (right) quality screens. Density estimates for the set of gold-standard common essential and non-essential genes are highlighted by the red and blue contours, respectively. Estimates using gene-averaging (GA; top plots) show broad systematic differences across all essential genes in these cell lines compared with the population average. These systematic differences are corrected for by D2 (bottom plots). b The screen quality estimated for each cell line (SSMD of positive/negative control gene dependencies, using GA) was correlated with the expression level of AGO2 for both the Achilles (Spearman’s rho = 0.39; p < 2.2 × 10⁻¹⁶; green) and DRIVE (rho = 0.37; p = 1.3 × 10⁻¹³; gold) datasets. c Correlation between each gene’s dependency profile and mRNA expression of AGO2 is plotted against the across-cell-line average dependency score for the gene, with curated common-essential and non-essential genes indicated with red and blue dots, respectively. Using D1 (left), gene dependency profiles were systematically (negatively) correlated with the AGO2 expression for more common essential genes. This correlation was eliminated using D2 (right)

