Fig. 4.
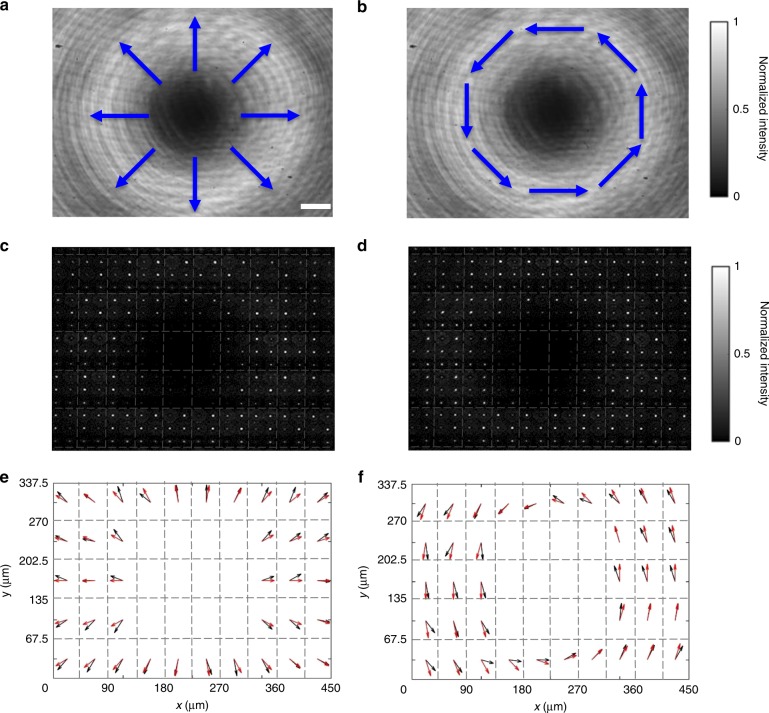
Profiling of vector beams by the metalens array. a, b Intensity distributions of focal spots for a radially polarized incident beam and an azimuthally polarized beam, respectively. The blue arrows qualitatively indicate the local polarization states. Scale bar: 50 μm. c, d Images of focal spots from the metalens array for the radially polarized and the azimuthally polarized beam, respectively. e, f Polarization profiles. The black arrows correspond to the measured local polarization vectors, the red arrows to the calculated ones. The dashed gray lines highlight the individual pixels of the metalens array

