
Fig. 1.
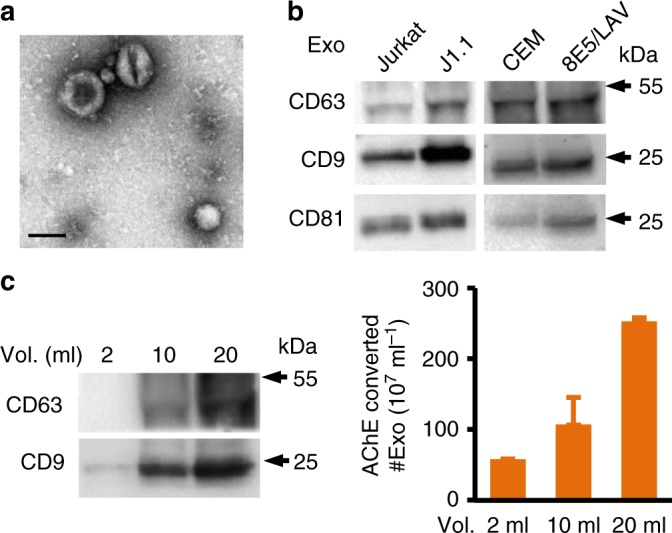
Characterization of exosomes from HIV-infected T cells. a Transmission electron microscope (TEM) images of exosomes isolated from T-cell culture supernatants. The representative J1.1 cell exosome image is shown. Scale bar, 100 nm. b Immunoblot of CD63, CD9, and CD81 on proteins extracted from T-cell line exosomes (whole scans of blots in Supplementary Figure 1). c CD63 and CD9 immunoblot (left) and AChE assays (right) of J1.1 exosomes isolated from 2, 10, and 20 ml of culture supernatants. Error bars, ± s.d. Data shown one experiment from three biological repeats. Numbers of exosomes (#Exo) were calculated by AChE activity using a standard provided by SBI