Fig. 2.
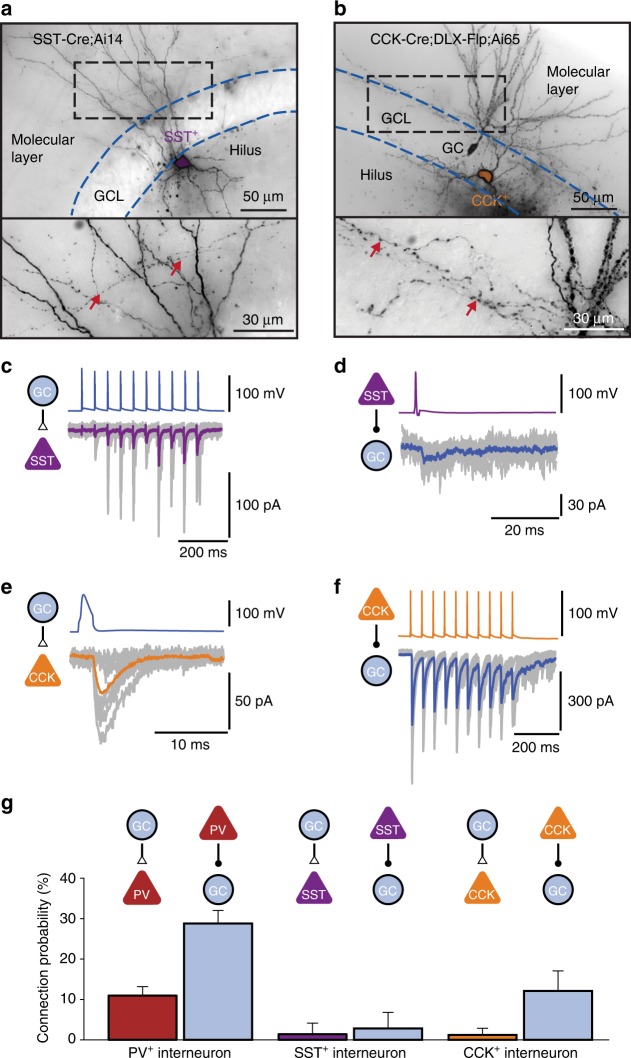
Differential connectivity of PV+, CCK+, and SST+ interneurons in the dentate gyrus. a Light micrograph of a SST+ interneuron filled with biocytin during recording, and visualized using 3,3′-diaminobenzidine as chromogen. Cells were identified by genetic labeling in SST-Cre mice. Axon branches in the molecular layer (red arrows) suggest that the cell was a HIPP or TML interneuron68, 69. GCL, granule cell layer. b Light micrograph of a CCK+ interneuron filled with biocytin. Cells were identified by genetic labeling in CCK-Cre;DLX 5/6-Flp mice. Axon branches in the inner molecular layer (red arrows) suggest that the cell was a HICAP interneuron68–70. c, d Excitatory and inhibitory connectivity of SST+ interneurons. GC–SST+ interneuron unitary EPSCs are shown in (c), SST+ interneuron–GC IPSCs are illustrated in (d). Individual synaptic responses (gray) and average trace (magenta or blue, 15 traces) are shown overlaid. Note the facilitation of EPSCs during train stimulation in (c). e, f Excitatory and inhibitory connectivity of CCK+ interneurons. GC–CCK+ interneuron EPSCs are shown in (e), CCK+ interneuron–GC IPSCs are illustrated in (f). Note the asynchronous release during and after train stimulation in (f), which is highly characteristic of CCK+ interneuron output synapses70. g Comparison of average connection probability for pairs with an intersomatic distance of ≤ 100 µm. Whereas PV+ interneurons were highly connected, SST+ and CCK+ interneurons showed a markedly lower excitatory and inhibitory connectivity (number of tested connections 767, 71, and 165). Error bars represent 95%-confidence intervals estimated from a binomial distribution

