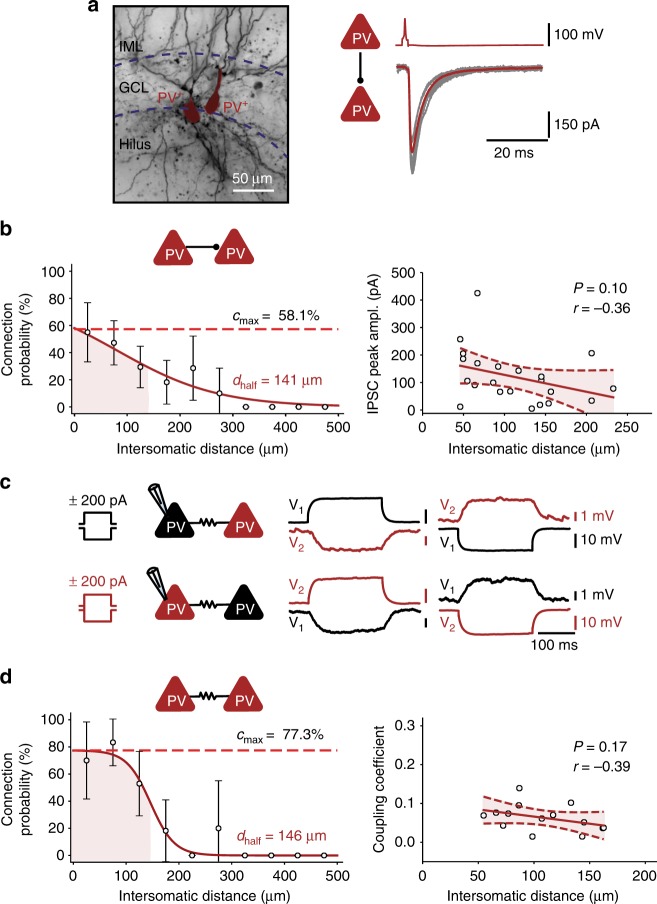
Fig. 4.
Rules of chemical and electrical connectivity between PV+ interneurons. a Left, light micrograph of a biocytin-labeled PV+ interneuron–PV+ interneuron pair. Right, unitary IPSCs, with individual synaptic responses (gray) and average trace (red, 15 traces) in the same pair. GCL, granule cell layer; IML, inner molecular layer. b PV+ interneuron–PV+ interneuron chemical connection probability (left) and IPSC peak amplitude (right) plotted versus intersomatic distance. Connection probability data points were fit with a sigmoidal function, IPSC amplitude data were analyzed by linear regression. Maximal connection probability was 58.1%, and space constant was 141 μm. c Electrical coupling between two PV+ interneurons. Voltage changes in the pre- and postsynaptic cell caused by the injections of long polarizing current pulses (left, + 200 pA; right, −200 pA; 200 ms) in one of the coupled cells. d PV+ interneuron–PV+ interneuron electrical connection probability (left) and coupling coefficient (right) plotted versus intersomatic distance. Maximal connection probability was 77.3%, and space constant was 146 μm. The coupling coefficient (CC) was calculated as the mean ratio of steady-state voltages (V2/V1, V1/V2) during application of current pulses in one of the cells (cell 1 and cell 2, respectively)

