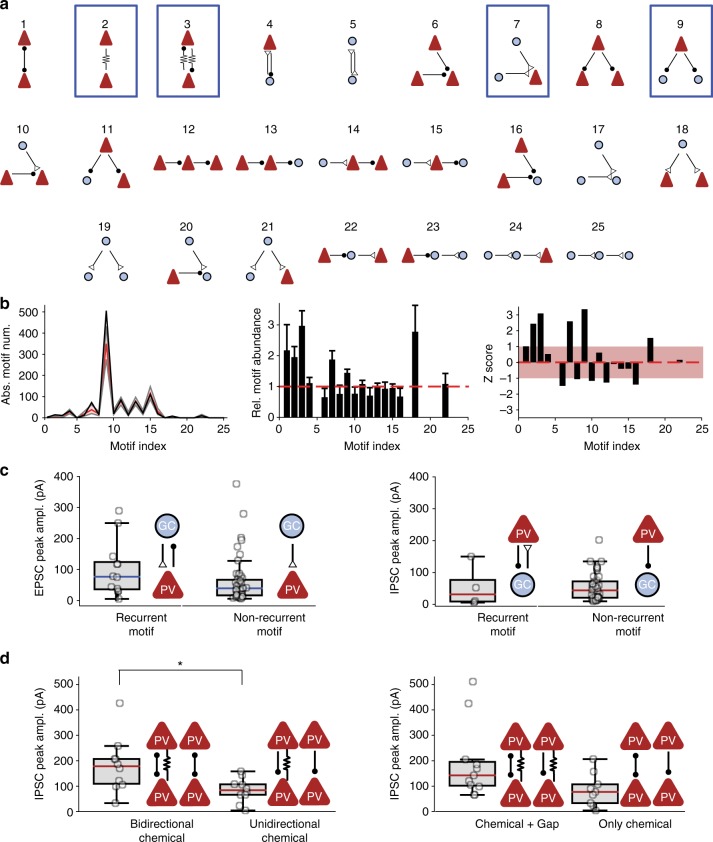
Fig. 5.
Overabundance of disynaptic connectivity motifs in GC–PV+ interneuron networks and different functional properties of synapses embedded in motifs. a Graph analysis of disynaptic connectivity motifs. In total, there are five possible disynaptic connectivity motifs with two cells and 20 disynaptic motifs involving three cells. Arrows with open triangles indicate excitatory synapses, arrows with filled circles represent inhibitory synapses, and arrows with zigzag lines indicate gap junctions. Number indicates motif index. b Analysis of the number of motifs in 10,000 simulated data sets. Connection probability for the simulated data set was specified according to the experimentally determined spatial rules. Left, absolute motif number in experimental (black) and simulated data set (red, median; gray, 90%-confidence interval). Center, bar plot of relative abundance of various motifs (number of motifs in experimental data set over mean number in simulated data set). Error bars were taken from bootstrap analysis. Right, bar plot of z score of the different motifs. Light red area indicates z score in the interval [−1, 1]. Motifs 2, 3, 7, and 9 were significantly enriched above the chance level (P = 0.03145, 0.0085, 0.0272, and 0.0068 after multiple comparison correction). In contrast, motifs 6, 8, 10, 12, and 16 were slightly, but not significantly underrepresented (P = 0.15 for motif 6). Note that motifs 5, 17, 19–21, and 23–25 were not encountered in the present data set, because of the lack of connectivity between GCs. c Comparison of EPSC peak amplitude (left) and IPSC peak amplitude (right) in bidirectionally versus unidirectionally coupled GC–PV+ interneuron pairs. Peak amplitudes were not significantly different (P = 0.33 and 0.58, respectively). d Comparison of IPSC peak amplitude in PV+ interneuron–PV+ interneuron pairs connected by different chemical or electrical synapse motifs. IPSC peak amplitude was significantly larger in pairs with bidirectional inhibitory connections than with unidirectional connections (P = 0.016) and slightly higher in connections with than without gap junctions (P = 0.057). Asterisk indicates P < 0.05

