Figure 7.
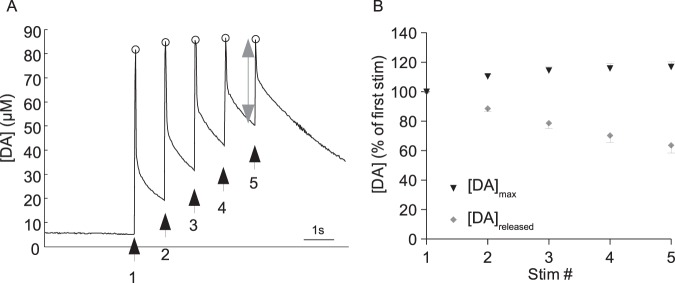
Signals evoked by 5 successive electric shock stimuli (100 ms, 10 V) presented at 1 s inter-stimulus intervals. (A) Trace shows changes in DA concentration over time. Circles signal the maximum DA concentration recorded in response to each stimulation. The arrows show the timing of successive stimulations. The double-headed arrow shows the concentration of DA released in response to the fifth stimulation. (B) Responses normalised to the DA signal recorded in response to the first stimulation, and averaged across individuals. The maximum concentration of DA recorded in response to each stimulus ([DA]max) is shown, along with the concentration of DA released in response to each successive stimulation ([DA] released). Data presented in this figure represent 89 measurements from 23 bees.

