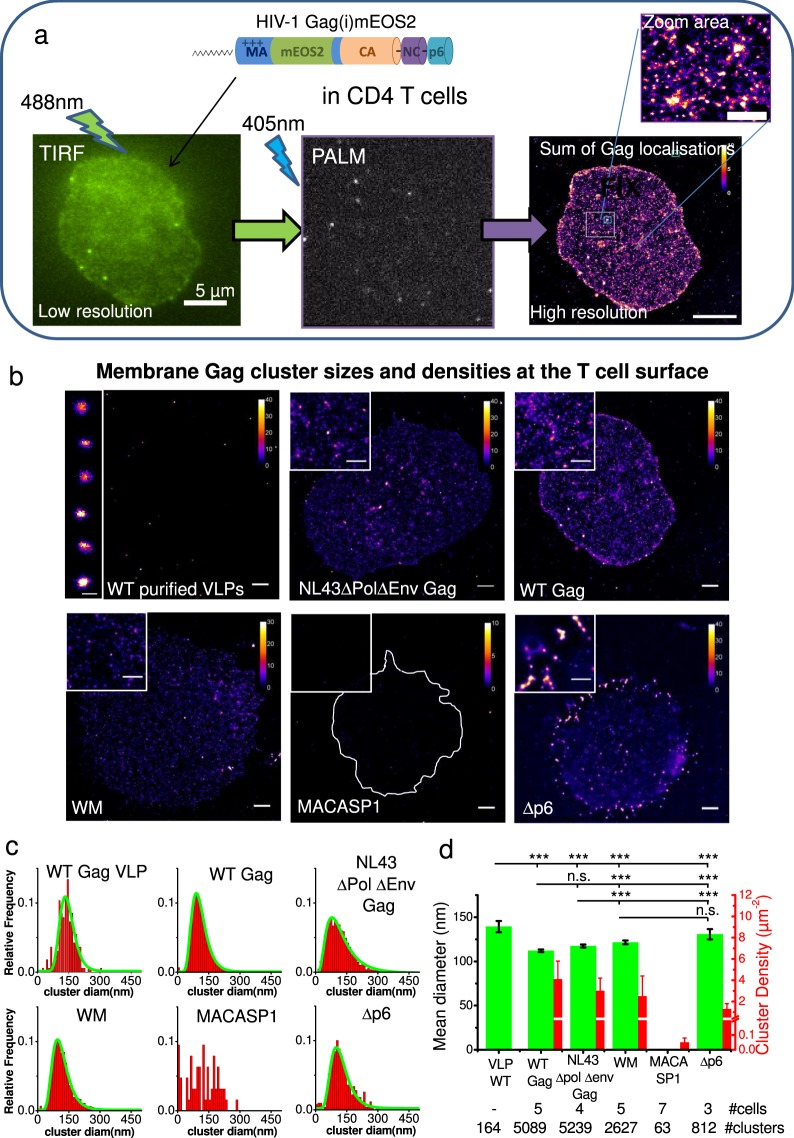
Figure 2.
HIV-1 Gag(i)mEOS2 and mutants cluster formation at the surface of Jurkat T cells observed by PALM. (a) Low resolution TIRF imaging and high resolution PALM imaging of Jurkat T cells expressing WT Gag(i)mEOS2 that lead after summing all Gag localisations to images of all assembly clusters. (b) Jurkat T cells that express WT Gag, NL4.3ΔPolΔEnv Gag, WM, MACASP1 or Δp6 were fixed and PALM imaging of the cell surface was performed using TIRF mode. Purified VLPs (left upper panel) from WT Gag productive cells were also analysed with this method and served as VLP size reference. Each image contains a zoom of a selected area of the depicted cell (2x, upper left inset). Scale bars: 2, 1 μm, respectively. (c) Size distribution (red) and their log-normal fit (green, when possible) of the different assembly clusters observed in T-cells. (d) In green, plot of the mean diameter (left y-axis) observed for each condition. Error bars are C.I. of the data. Differences observed according to Student’s t-test were performed on log values of the diameter’s distributions. (***p < 1.10−4, see Table S1 for exact p values). In red, plot of the assembly clusters surface densities at the cell membrane for each condition, illustrating the drastic decrease for MACASP1. Error bars are C.I. of the surface densities.

