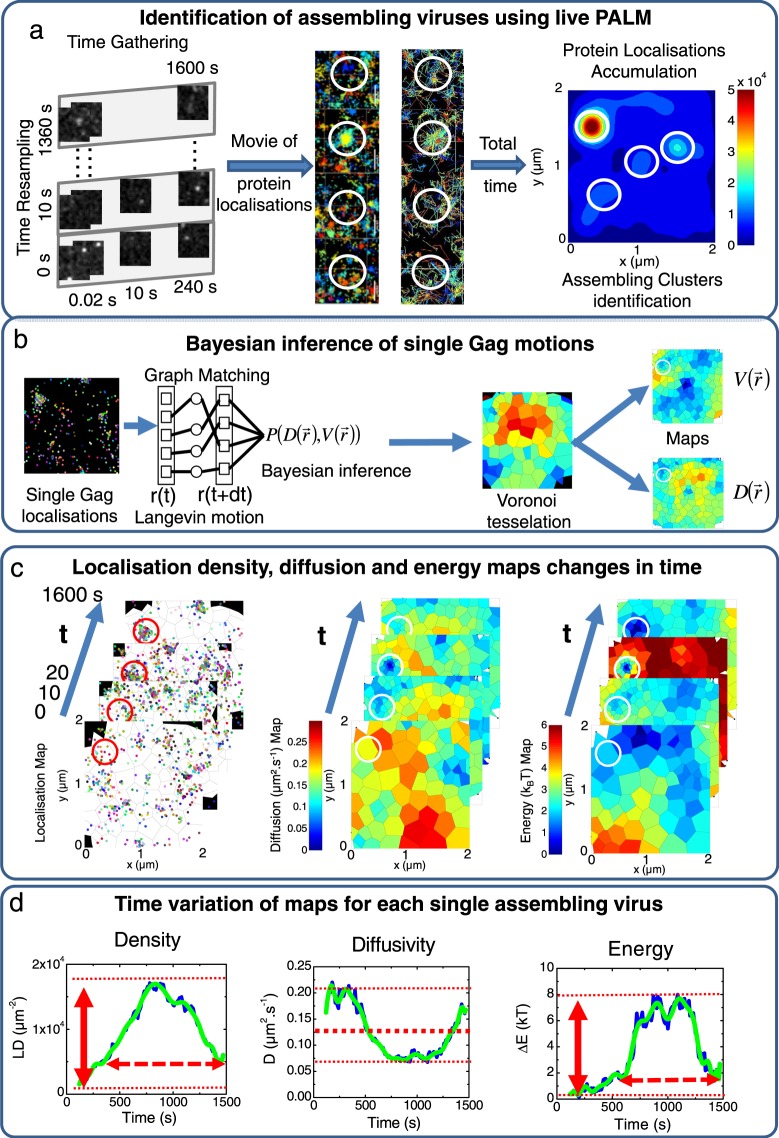
Figure 3.
Monitoring time evolution of localisation densities, diffusivities and effective energies to characterise HIV-1 Gag(i)mEOS2 assembling VLP properties. (a) Single molecule localisations of each acquired image every 0.02 s are accumulated post experimentally for 240 s and gathered in a new image. This process is reproduced with a 10 s time shift until the end of the experimental acquisition (1600 s). Each newly generated image is used to make a movie illustrating changes of localisation over time. Here are shown typical examples of localisation changes over time during assembly of WT Gag and, as an illustration, typical trajectories observed around an assembling VLP. All trajectories seem to be directed towards the centre of the assembling VLP. Finally, projection of the images of this movie gives the total density accumulation in each experimental set of data, allowing identification of potential assembling clusters (white circles) for the analysis. (b) Localisations in each frame are reconnected using graph matching, an overdamped Langevin equation to describe molecular motion and Bayesian Inference. Using Voronoi tessellation, single-molecule images are divided in sub-areas containing the same number of localisations (n = 40) allowing for the generation of maps (see methods for details). (c) Maps of localisation densities, diffusion coefficients and effective energy are then generated for different times as in a), x- and y-axis values corresponding to the position in μm inside the PALM image. (d) From these maps we extract plots of localisation density (LD, μm−2, left panel), diffusion (centre panel) and effective energy (right panel) variations over time, during assembly of one VLP. From these these plots, the localisation density increase (LDI, red arrow, left panel) and the assembly time length (red dotted arrow, left panel) were quantified for each assembling VLP for WT Gag and mutants. The mean diffusion constant was also obtained (bold dotted line, centre panel) as well as the maximum trapping energy (red arrow, right panel) and the time length of trapping energy increase (dotted red arrow, right panel).

