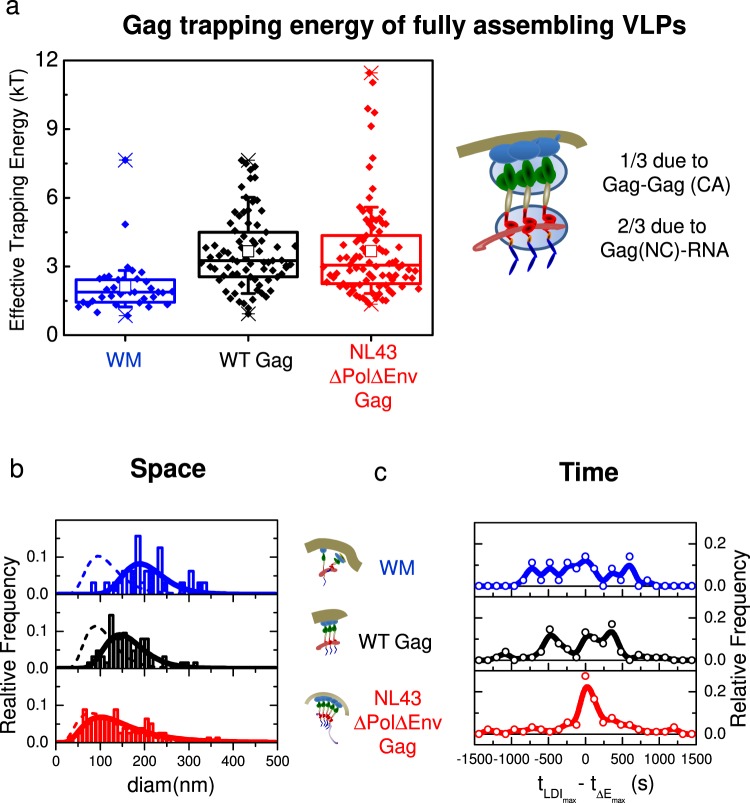
Figure 5.
The spatio-temporal coordination of membrane Gag assembling VLPs. (a) Box plot of the maximum effective trapping energy observed in fully assembling VLPs. (b) Normalised distributions (bars) and their log-normal fits (plain lines) of the diameters at full width at half maximum (FWHM) of the maximal intensity attractive potentials for WM (blue), WT Gag (black) and NL4.3ΔPolΔEnv Gag (red). Dashed line represents the log-normal fit of the assembling clusters distribution observed in fixed cells and depicted in Fig. 2. (c) Normalised distributions of the difference between the time to reach the maximum localisation density increase (LDI) and the time to reach the maximal energy trapping for WM (blue), WT Gag (black) and NL4.3ΔPolΔEnv Gag (red). Distributions were significantly different according to the Kolmogorov-Smirnov test (see Table S4 for values).

