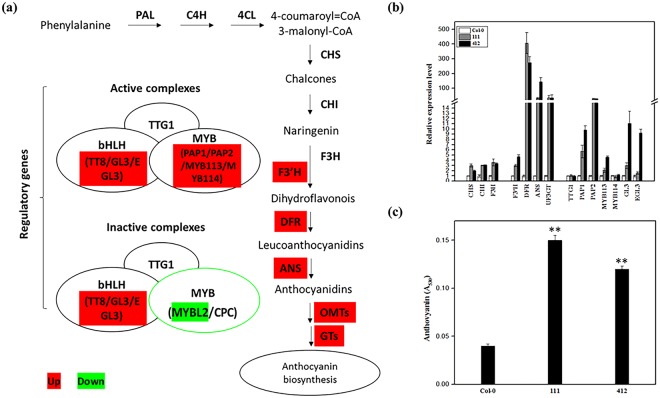
Figure 4.
Anthocyanin biosynthesis analysis of Col-0, and lines 111 and 412. (a) Schematic diagram of the anthocyanin biosynthetic pathway modified based on Viola et al.41. Genes up- and downregulated in the pathway are shaded in red and green, respectively. (b) Transcript levels of structural genes early biosynthesis genes, chalcone synthase, CHS, chalcone isomerase, CHI, flavanone 3-hydroxylase and flavonoid 3′-hydroxylase, F3H, and late biosynthesis genes dihydroflavonol 4-reductase, F3′H, leucoanthocyanidin oxygenase, DFR, anthocyanidin reductase, ANS, and UDP-glucose:flavonoid 3-O-glucosyltransferase, UF3GT, and regulatory genes (TTG1, PAP1, PAP2, MYB113, MYB114, GL3, and EGL3) involved in anthocyanin biosynthesis detected by quantitative RT-qPCR using total RNA extracted from 6-week-old Col-0, line 111 and line 412. The p-value of each gene did in this test was listed in the Table S2. (c) Anthocyanin contents in 8-week-old seedlings of Col-0, 111 and 412. Mean ± SD of n = 3 independent experiments. **P < 0.01.

