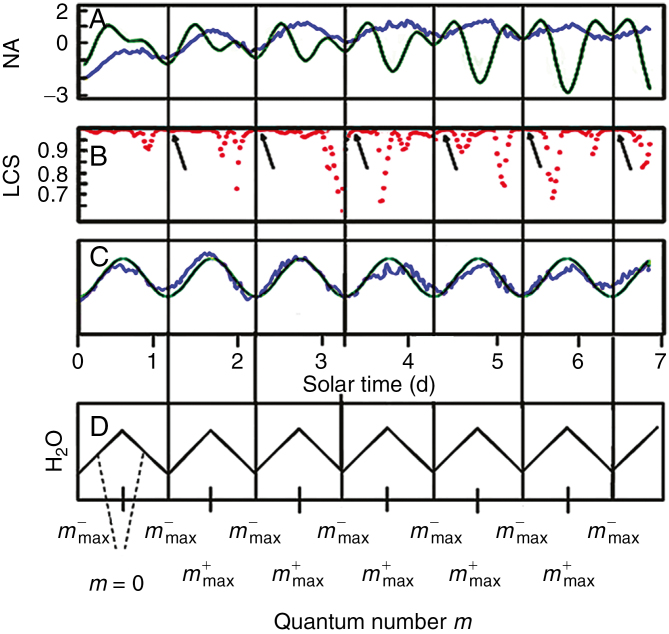
Fig. 2.
Comparison between root elongation rates after transfer from long days of 16 h:8 h to continuous illumination, as well as the lunisolar tidal profiles and a 24.8 h sine wave. Roots of Arabidopsis thaliana seedlings were entrained using photoperiods of long days of 16 h:8 h, with n = 23 seedlings. On day 15, the light protocol was changed so that the seedlings were exposed to continuous illumination. (A) The blue trace denotes the averaged root elongation rate (µm h–1) of seedlings (n = 23) in continuous illumination. The green trace indicates the lunisolar gravity profile (in µGal). Vertical lines specify the coincident positions of the troughs in both the root growth rate and the lunisolar gravity profile. (B) Local correlation score of the data profiles in (A). Arrows indicate sites of high local cross-correlation scores between the respective troughs in root growth rate kinetics and lunisolar tidal profiles. (C) Alignment of the average root growth rate with a 24.8 h sine wave (green trace). (D) Modulation in the particle number of the coherent water molecule unit as a function of the lunar gravitation-associated quantum number. m+ indicates an increase in the quantum number and m– a decrease in the quantum numbers. During the daily rotation of the Earth around its axis, the test mass crosses the quantum numbers m up to a certain m+max before it cycles back to m–max.

